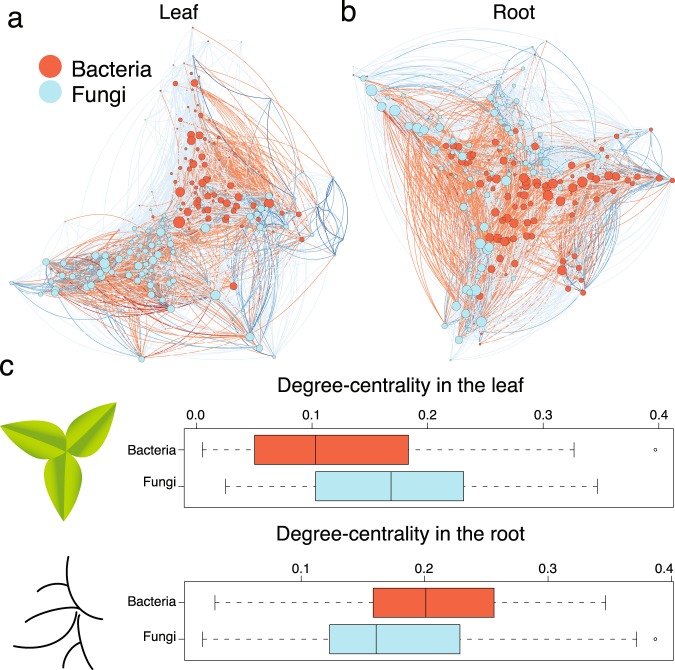
Figure 2.
Network analyses of the root and leaf microbiome. Network analyses of Pearson correlation coefficients reveal that both bacteria and fungi are key taxa in the (a) leaf and (b) root microbiome. The size of each node represents its degree; its color represents its kingdom (blue for fungi, red for bacteria). Edges (lines) between nodes are colored blue for positive correlations between taxa; negative correlations are colored red. The networks are plotted using a Davidson-Harel layout. (c) Fungi have more connections (measured by degree centrality) than bacteria in the leaf microbiome, but a similar number of connections in the root microbiome.

