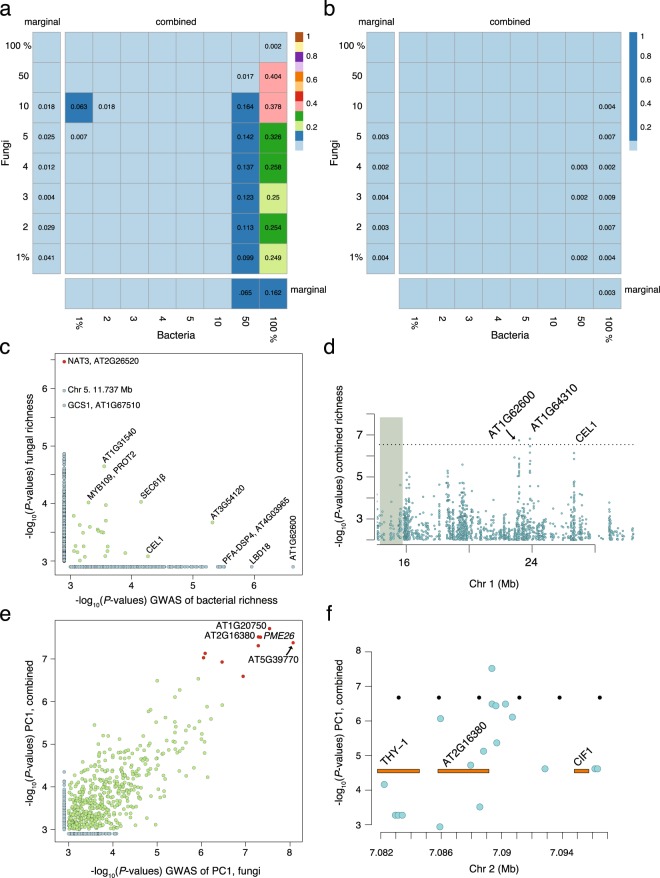
Figure 4.
Evidence that hosts shape their microbiome is stronger when taking into account cross-kingdom correlations. (a,b) The color and number in each square represents the P-value from (n = 999) permutation tests that investigate whether genetic differences among accessions shape the bacterial and fungal communities independently or as a combined microbiome (see Methods). The labels along the margins indicate how much of the community was considered in each analysis (e.g. top 1% refers to the top 1% best-sequenced taxa) and is sorted in decreasing abundance. The bars along the margins report the results from single-kingdom (marginal) analyses, while the grids in each panel show the results from the combined (bacteria + fungi) community analyses. The P-values in each square are shown when P > 0.001 (that is, empty squares occur when P = 0.001). The plot in (a) shows the results from analyzing the first three PCs, while (b) shows the results from analyzing the first five PCs. (c) The overlap in the results (10-kb windows) from GWAS of bacterial and fungal richness. (d) The results from GWAS of richness in the combined bacterial and fungal community along the lower arm of chromosome 1. (e) The overlap in the results (10-kb windows) from GWAS of PC1 from PCA of the fungal community (x-axis) and the combined fungal and bacterial community (y-axis). (f) The results from GWAS of PC1 from PCA of the combined microbiome include a peak on chromosome 2 that falls between AT2G16380 and CIF1. For (c,e) significant results are shown in red. All GWAS were performed using a linear mixed model in order to adjust/account for confounding due to population structure.

