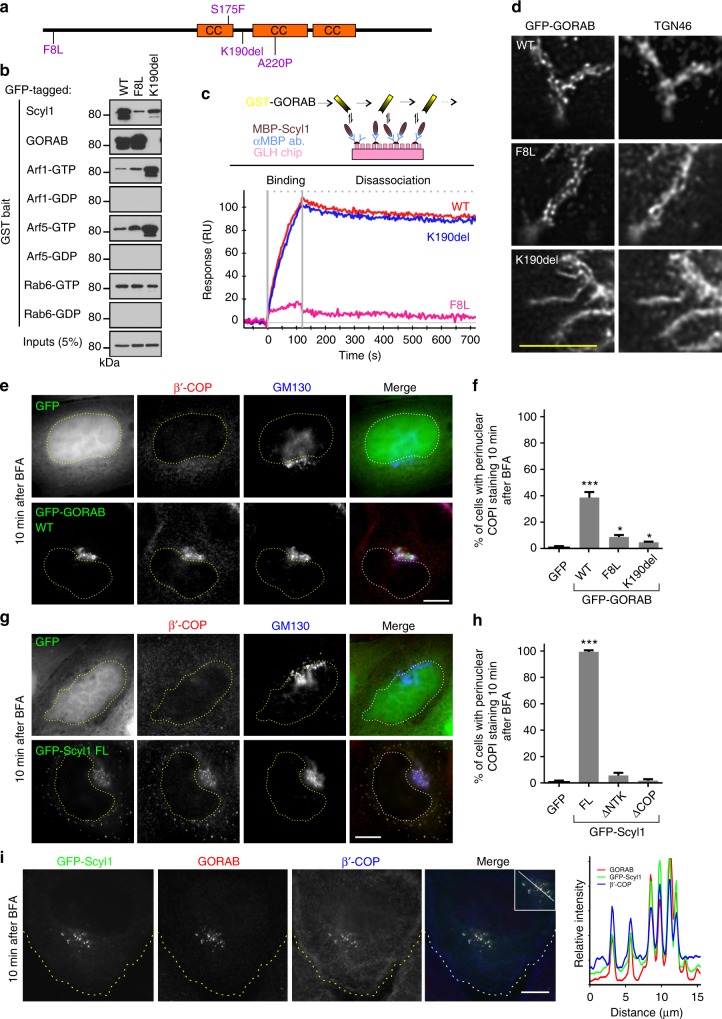
Fig. 4.
Effect of pathogenic missense mutations upon GORAB behavior. a Location of known missense and single base deletion GORAB mutations in GO patients. Coiled-coil domains are depicted as orange rectangles. b Interaction of GORAB variants with GST-tagged bait proteins, as indicated, using cell lysates from RPE-1 cells expressing the indicated GFP-tagged GORAB variants. Inputs (5%) and bound fractions (50%) were blotted for GFP. c Surface plasmon resonance analysis of GORAB-Scyl1 binding. Top, experimental setup with a GLH sensor chip, cross-linked anti-MBP antibody, MBP-Scyl1 as bound ligand and GST-GORAB variants as analyte. Bottom, binding of GST-GORAB variants at 30 nM concentration for 120 s followed by 600 s disassociation. Similar results were obtained in three separate experiments. d Golgi localization of GFP-tagged GORAB variants using STED microscopy. RPE-1 cells were fixed and labeled with TGN46 antibodies. Scale bar, 5 µm. e COPI subcellular localization in HeLaM cells transfected with GFP or GFP-GORAB and incubated for 10 min with 5 µg/mL BFA. Cells were labeled with antibodies to β’-COP and GM130. Scale bar, 10 µm. Dotted line marks the nucleus. f Quantification of COPI retention in the Golgi region from e. Error bars represent mean ± SD, n = 100 cells in each of 3 independent experiments, *p ≤ 0.05 and ***p < 0.001, unpaired t-test. g COPI subcellular localization in HeLaM cells transfected with GFP or GFP-Scyl1 fixed 10 min after incubation with 5 μg/mL BFA. Cells were labeled with antibodies to β’-COP and GM130. Scale bar, 10 µm. Dotted line marks the nucleus. h Quantification of COPI retention in the Golgi region from g. Error bars represent mean ± SD, n = 100 cells in each of 3 independent experiments, ***p < 0.001, unpaired t-test. i Co-localization between GFP-Scyl1, β’-COP and GORAB in HeLaM cells fixed 10 min after incubation with 5 μg/mL BFA. Cells were labeled with antibodies to GORAB and β’-COP. Scale bar, 10 µm. Dotted line marks the cell boundary. The white line indicates the pixels used for the RGB fluorescence intensity profile plot on the right, which is representative of data from n = 20 cells

