Fig. 2.
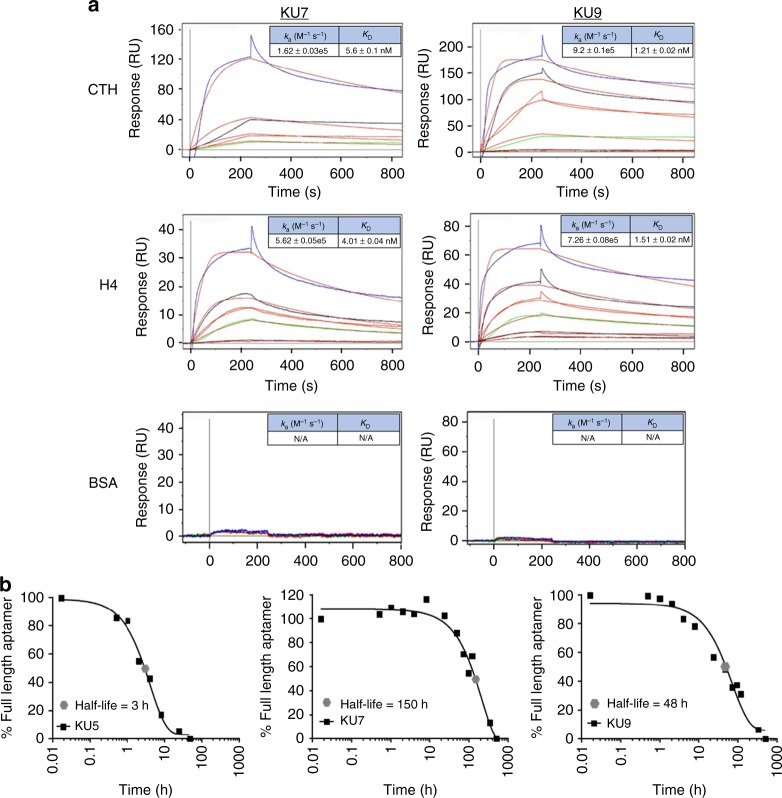
Binding characterization and stability measurements of individual histone RNA aptamer sequences. a Binding kinetic rate constants (ka and KD) determined for aptamers KU7 (left panels) and KU9 (right panels) binding to CTH (top panels), H4 (middle panels) and BSA (bottom panels). Aptamers concentrations tested: 100 nM (blue), 50 nM (black), 25 nM (red), 12.5 nM (green), 10 nM (magenta). b Serum stability measurements for aptamers KU7 and KU9 (5 μM) in 50% human serum. T1/2 KU7 = 150 h. T1/2 KU9 = 48 h

