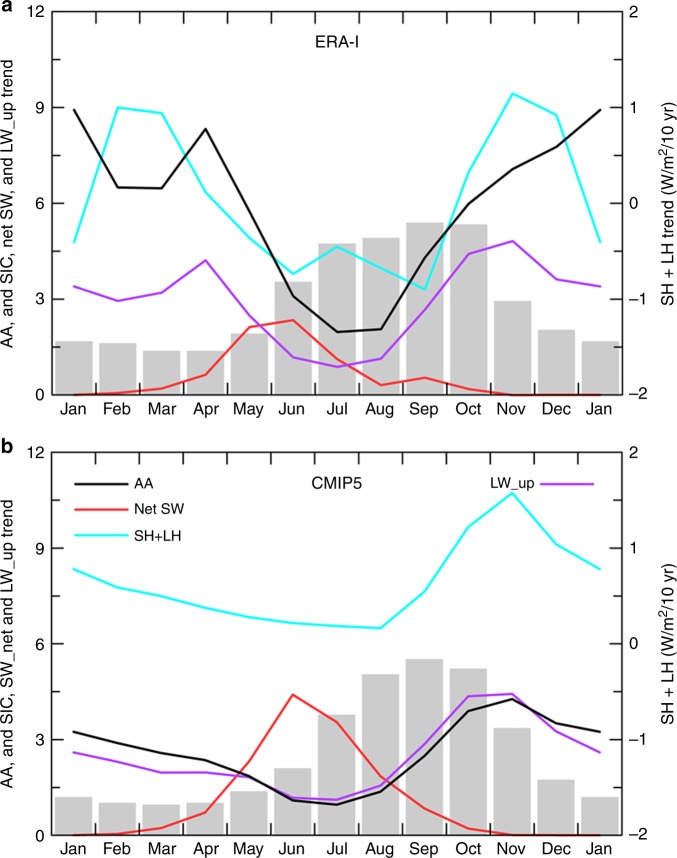
Fig. 1.
Seasonality of the historical (1979–2016) trends in Arctic (67°–90°N) sea-ice cover (SIC), Arctic amplification (AA), and Arctic energy fluxes. a from ERA-Interim reanalysis data and b from the ensemble mean of historical (for 1979–2005) and RCP8.5 (for 2006–2016) simulations averaged over 38 CMIP5 models. The SIC trend (gray bars) is in 105 km2/decade; the AA (black line) is defined as the ratio of the surface air temperature trends between the Arctic and the globe; the surface net shortwave (red, positive downward), sensible plus latent heat (blue, positive upward) and upward longwave (magenta) flux trends are in W/m2/decade

