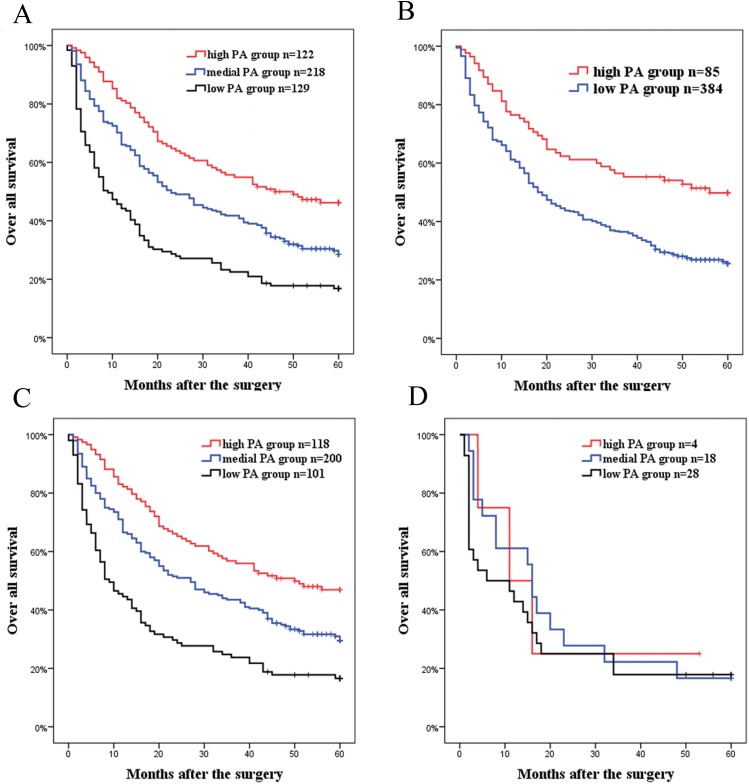
Fig. 1. Kaplan-Meier curves for different PA group patients.
(A) Best cut-off value (low PA group: male <120 mg/L, female <110; medium PA group: male 120–190 mg/L, female 110–170 mg/L; high PA group: male >190 mg/L, female >170 mg/L) (p < 0.001). (B) Clinical cut-off value (low PA group: <200 mg/L; high PA group: ≥200 mg/L) (p < 0.001). (C) Child-Pugh A patients divided according to the best cut-off of PA (p < 0.001). (D) Child-Pugh B patients divided according to the best cut-off of PA (p = 0.719).

