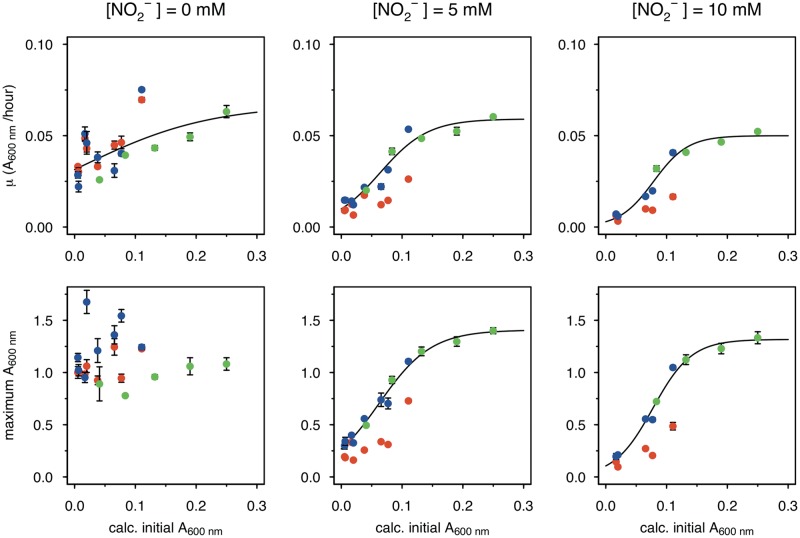
FIG 5.
Inoculum size effect on MnOX-mediated mitigation of nitrite inhibition. Data from different AzwK-3b growth experiments of similar type (large inocula; see Materials and Methods) were analyzed for the maximum A600 (bottom row) and growth rate (top row) by fitting the growth curves. Each condition was done in three technical replicates (note that error bars are not visible in some cases due to only small differences). Nitrite concentrations of the main cultures are indicated as headings of the figure columns. The x axes show the calculated A600 values of the initial cultures after diluting them 1:1 from the precultures, while the y axes show the maximum A600 and maximum growth rate values as calculated with the Gompertz model (91, 92) (see Materials and Methods). The colors represent different conditions, as follows: red, neither preculture nor main culture contained manganese; blue, preculture without and main culture with manganese; and green, both preculture and main culture with manganese. The black curve is a sigmoidal fit (logistic model) from the R package Grofit (91), for the results of the combined blue and green data set, where the nitrite-exposed main cultures all contained manganese.

