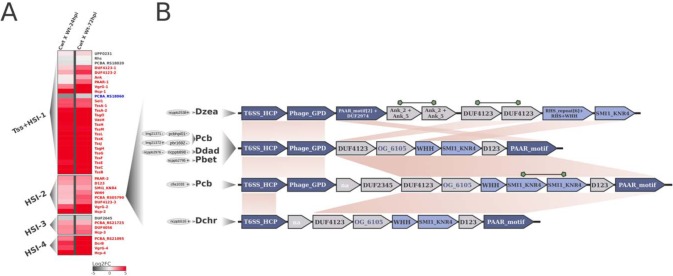
FIG 1.
Transcriptional variation in planta of T6SS-related genes in Pcb1692 and linkage between the endonuclease WHH and HSI in SRE genomes. (A) Each row on the heatmap represents a gene labeled after its (i) respective encoded protein name, (ii) functional domain, or (iii) locus tag given annotation availability. The two columns of the heatmaps represent pairwise comparisons between samples; thus, each cell shows the variation in transcription found in each comparison, illustrated by a color scale ranging from −5 (dark gray) to 5 (red), representing the log2 fold change in expression. For each gene label, statistical significance of regulation is represented with the following colors: red, upregulation; blue, downregulation; gray, no support for regulation. Column labels: Cwt, control wild type; Wt-24hpi/Wt-72hpi, wild type at 24/72 hpi in potato tubers. Four segments in the heatmap separate T6SS-related clusters, type VI secretion (Tss) and Hcp secretion island (HSI), located in different genomic regions, namely, Tss+HSI-1, HSI-2, HSI-3, and HSI-4. (B) Gene neighborhood of WHH-SMI1_KNR4 duplets in the 10 SRE strains conserved within HSIs. Among the 100 SRE strains analyzed, those exhibiting linkage between WHH-SMI1_KNR4- and Hcp/PAAR-encoding genes are represented. Each gene arrangement is associated with its respective strain(s), represented on the left side by 4-letter abbreviations: Dzea, Dickeya zeae; Pcb, Pectobacterium carotovorum subsp. brasiliense; Ddad, Dickeya dadantii; Pbet, Pectobacterium betavasculorum; Dchr, Dickeya chrysanthemi. For each species, the respective number of strains conserving that particular gene arrangement is represented in gray ellipses on the left. The WHH-SMI1_KNR4 duplets (Pfam PF14414 and PF09346, respectively) are highlighted in light blue. Hcp (T6SS_HCP; Pfam PF05638), VgrG (Phage_GPD; Pfam PF05954), and PAAR (PAAR_motif; Pfam PF05488) genes are highlighted in dark blue. Syntenically conserved blocks across the different gene arrangements are linked by light-brown areas. Duplicated genes in a single arrangement are linked by green shapes. Successfully clustered products in orthologous groups for which no conserved domains were detected are highlighted in dark blue.

