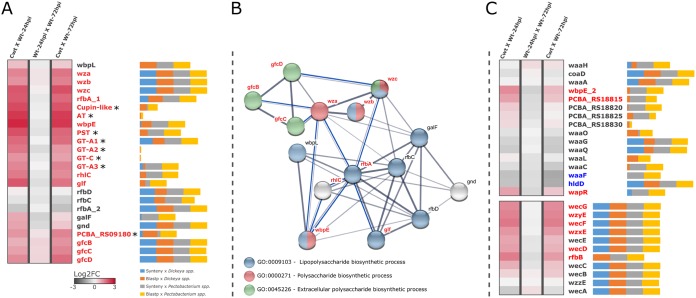
FIG 4.
In planta transcriptional profile, genomic conservation, and annotation of dedicated polysaccharide clusters in Pcb1692. (A) Heatmap of GFC operon as described in the legend to Fig. 1. Asterisks next to genes indicate those for which no orthology relationship could be assessed; as such, they are not represented in the network. Next to each gene name, horizontal bars (percentage-stacked) display their respective conservation compared with SRE genomes of Dickeya (39 strains) and Pectobacterium (60 strains) genera. These bars include overall frequencies of BLASTP (sequence similarity) and MCScanX (syntenic conservation) searches of Pcb1692 gene products against 99 SRE complete data sets. The bars are divided in segments: syntenic with Dickeya spp. (blue), BLASTP positive against Dickeya spp. (red), syntenic with Pectobacterium spp. (gray), and BLASTP positive against Pectobacterium spp. (yellow). (B) Correlational network denoting the annotated gene association between successfully predicted Pcb1692 orthologs in E. coli and P. aeruginosa according to the STRING database (77) as well as showing respective GO term annotations. Thickness of network links are proportional to the combined scores obtained from the STRING algorithm. Blue lines represent new coregulation evidence found in our transcriptome data set between genes for which other categories of associations are known. Those entries not annotated in the three major GO terms shown in the network are highlighted in gray. (C) Transcriptional variation of waa (top) and wec (bottom) gene clusters represented as described for panel A.

