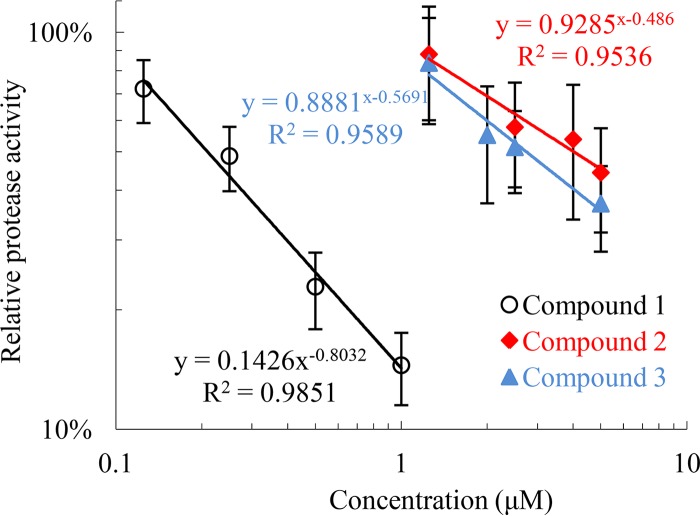
FIG 4.
Concentration-response analyses of the three AHLs. Series of different concentrations of each AHL were used to treat V. coralliilyticus RE22Sm and the protease activities were measured. Concentration-response curves (trend lines) of each AHL were obtained. Data are the averages from two independent experiments and each independent experiment had three replicates. Error bars represent one standard deviation.

