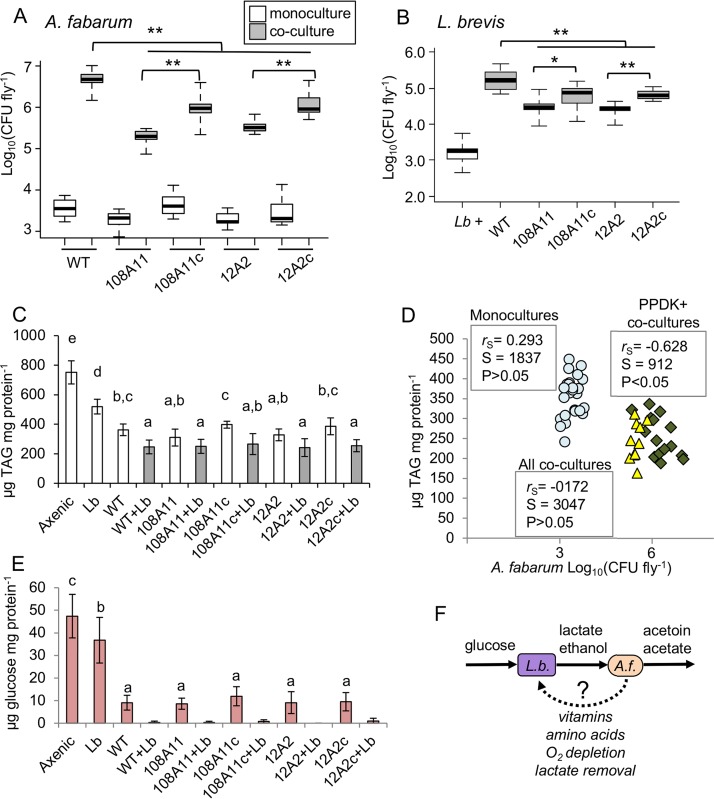
FIG 4.
Mutualism in vivo and its impact on Drosophila nutrition. (A and B) Cell densities of A. fabarum (A) and L. brevis (Lb) (B) in pools of three female gnotobiotic flies at 5 days post eclosion. White bars indicate single-species associations, and gray bars indicate coculture associations including L. brevis and the indicated strains of A. fabarum. WT, wild type; 108A11 and 12A2, transposon ppdK mutants; 108A11c and 12A2c, complemented ppdK mutants. Pairwise Wilcoxon tests compared the bars indicated with brackets; *, P < 0.05; **, P < 0.01, after Bonferroni correction (n = 15 to 18). (C) TAG contents of fly homogenates from the indicated treatment groups, normalized to the protein concentrations determined for the same samples (mean ± standard deviation [n = 18]). Treatments that do not share a letter above the bars are significantly different by Tukey’s HSD test, P < 0.05. (D) Correlation between A. fabarum abundance and TAG contents in fly homogenates. Values are matched on the basis of vial, and correlation statistics are from Spearman’s rank order test. Circles, monocultures; diamonds, cocultures with A. fabarum with ppdK; triangles, cocultures with A. fabarum ppdK mutants. (E) Glucose contents of Drosophila diet after gnotobiotic rearing with the indicated bacteria, normalized to soluble protein concentrations (mean ± standard deviation [n = 12]). Treatments that do not share a letter above the bars are significantly different by Tukey’s HSD test, P < 0.05. Coculture treatments were not included in the statistics because ≥50% of the samples did not have detectable glucose. (F) Model for metabolic mutualism between L. brevis (L.b.) and A. fabarum (A.f.). Solid arrows indicate connections with experimental support, while the dotted arrow represents hypothesized benefits to L. brevis.

