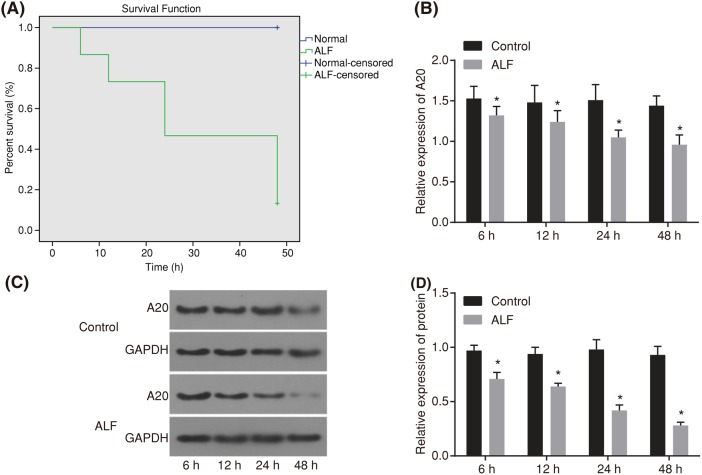
Figure 1. Survival analysis for rats within 48 h and expression of A20 at different time points.
(A) Survival analysis within 48 h of normal rats (n=30) and ALF rats (n=30, induced by injection of D-GalN 800 mg/kg and LPS 10 μg/kg). (B) mRNA expression of A20 within 48 h in normal and ALF rats detected by RT-qPCR. (C) and (D) Western blot analysis for protein expression of A20 within 48 h in normal and ALF rats. The data were presented as a mean ± standard deviation, analyzed by one-way analysis of variance. *P<0.05, compared with the normal group.

