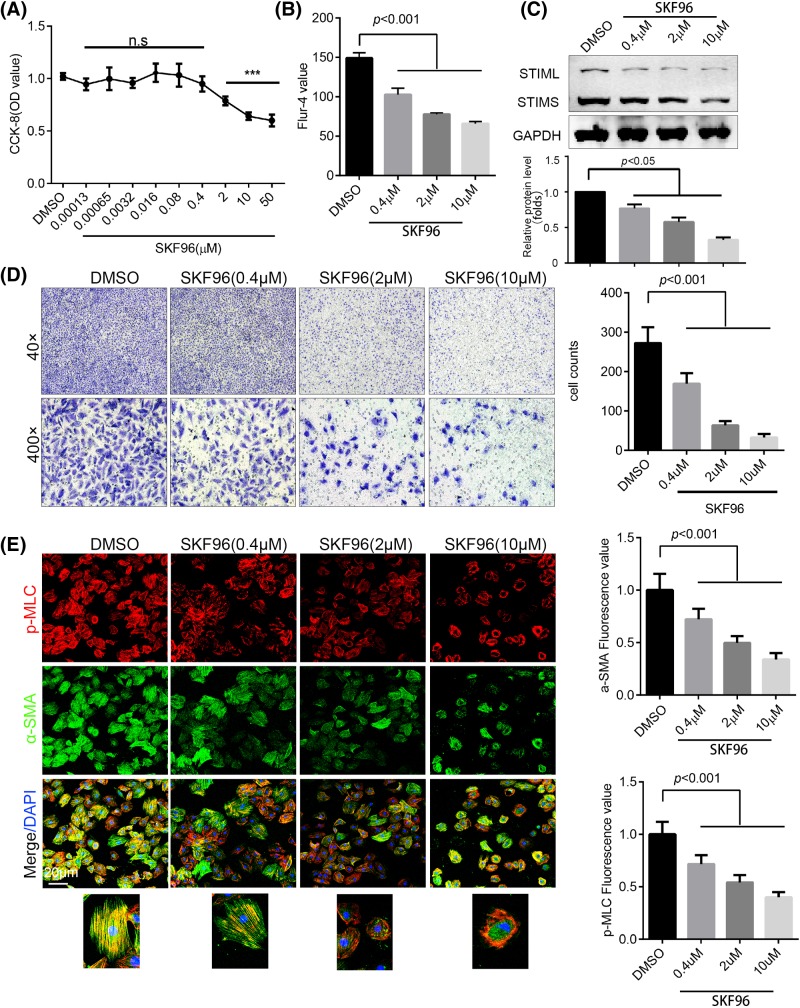
Figure 3. SKF96365 impaired H-ASMC viability and mobility.
(A) Cell viability after treatment with different doses of SKF96365 for 24 h, as assessed by CCK-8 assay; n=6. (B) Cytoplasmic calcium was stained by Fluo-4 and detected by flow cytometry; n=3. (C) H-ASMCs treated with different doses of SKF96365 for 24 h, with STIM1 expression detected by Western blotting; n=3. (D) H-ASMCs pre-treated with different doses of SKF96365 for 6 h, with migration detected using a transwell assay. Representative images are shown; n=3. (E) H-ASMCs administrated with various doses of SKF96365 for 24 h. p-MLC (red) and α-SMA (green) were stained and images captured by confocal microscopy (left panel). The fluorescence value was calculated by ImageJ; n=3. Data are represented as mean ± S.D., ***P<0.001 compared with DMSO group.

