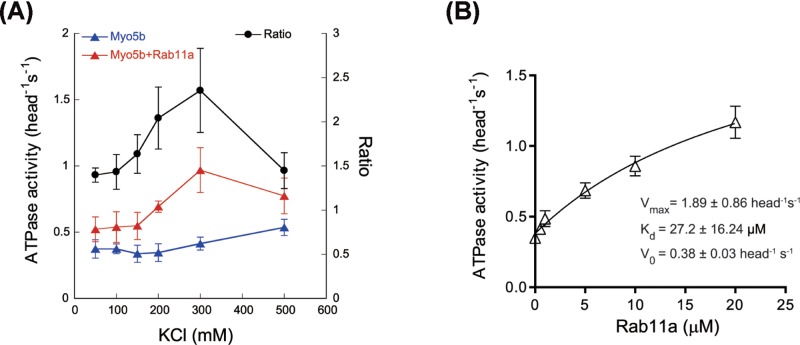
Figure 2. Characterization of Rab11a activation of Myo5b ATPase activity.
(A) Ionic strength dependence of Myo5b-FL ATPase activity in the absence (blue triangle) or presence of 12 μM GST–Rab11a (red triangle). Closed circle, the ratio of Myo5b ATPase activity in the presence of GST–Rab11a versus that in the absence of GST–Rab11a. The ATPase activity was measured as described in Figure 1D, except for the indicated concentrations of KCl. Values are mean ± S.D. from three independent assays. (B) Rab11a dependence of Myo5b-FL ATPase activity. The ATPase activity was measured as described above except that 0.2 M KCl and the indicated concentrations of GST–Rab11a were used. The data were fit to a hyperbola V = V0 + Vmax * [Rab11a]/(Kd + [Rab11a]), where V0, the ATPase activity in the absence of Rab11a; Vmax, the maximal Rab11a-activated ATPase activity; and Kd, the concentration of Rab11a that simulates the ATPase activity to 50% of Vmax. Values are mean ± S.D. from three independent assays.

