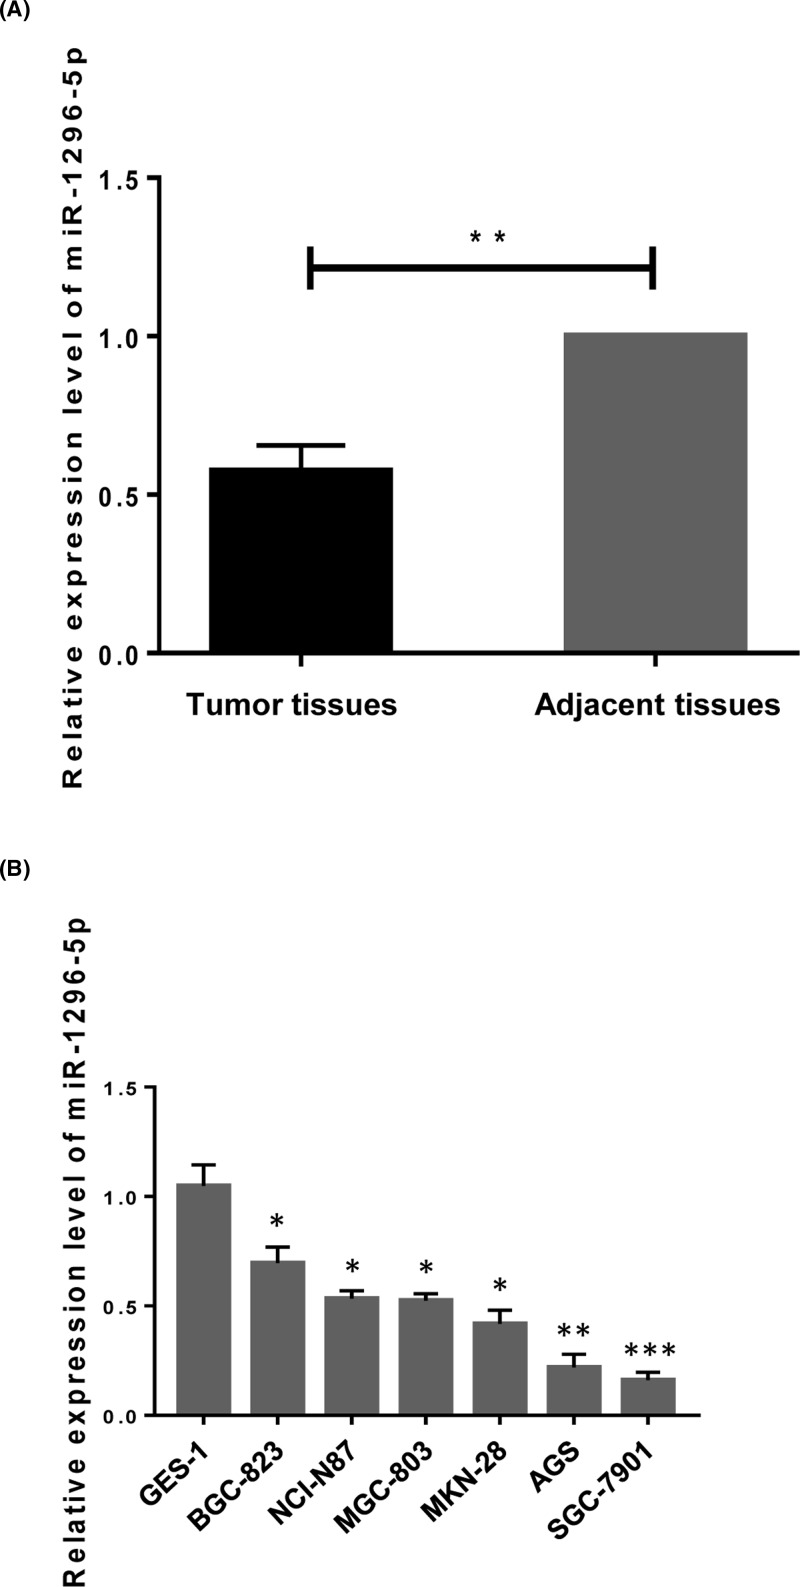
Figure 1. Relative expression level of miR-1296-5p.
miR-1296-5p is down-regulated in GC. (A) The expression pattern of miR-1296-5p in GC and matched adjacent normal tissues. **P<0.01 compared with the matched normal tissues. (B) The expression of miR-1296-5p in GES-1 normal gastric epithelial cells and six GC cell lines. Values represent the mean ± SEM. *P<0.05, **P<0.01, and ***P<0.001 vs. GES-1 cells.

