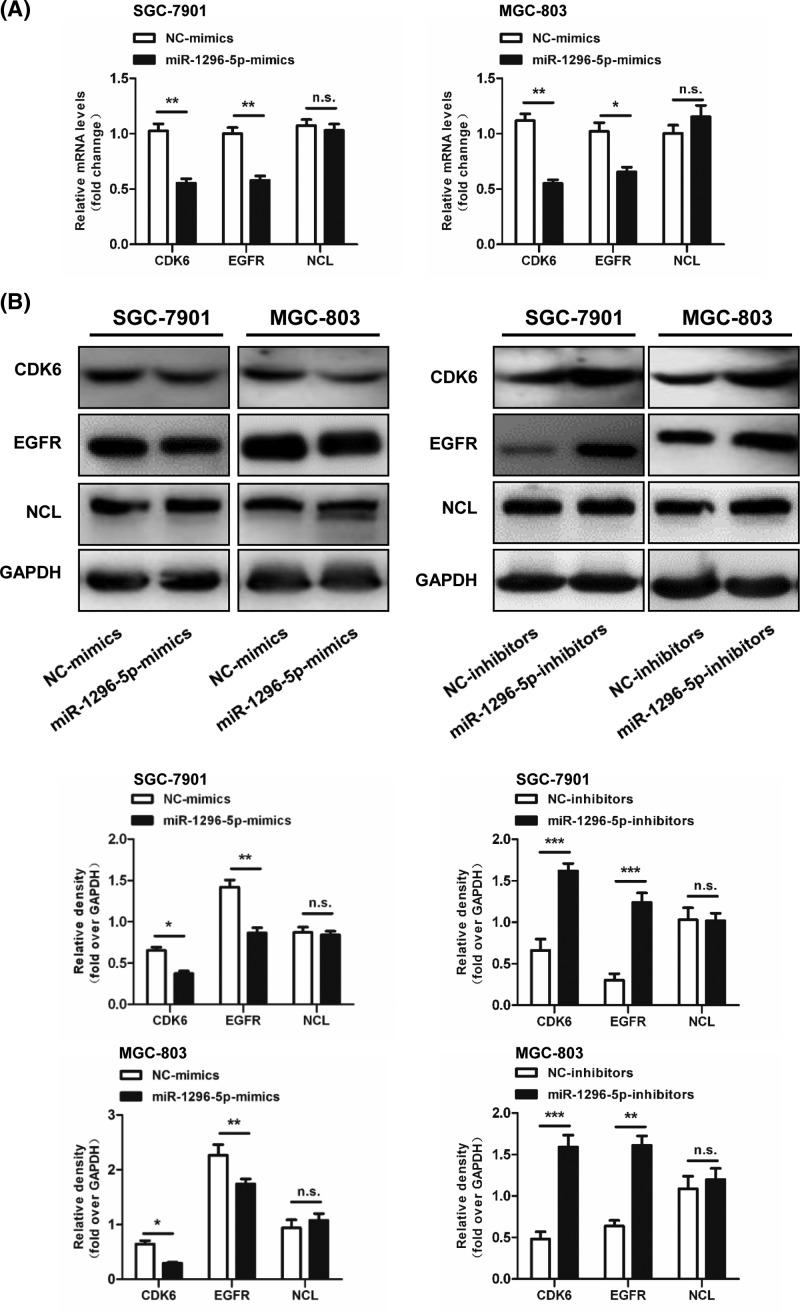
Figure 5. Identification of miR-1296-5p target genes.
(A) Relative mRNA levels of CDK6, EGFR, and NCL in SGC-7901 and GSC-803 cells. (B) Representative Western blots for CDK6, EGFR, and NCL in SGC-7901 and GSC-803 cells. Bar graphs represent the mean ± SEM from three independent experiments; n.s. indicates not statistically significant; *P<0.05, **P<0.01, and ***P<0.001 vs. the indicated groups.

