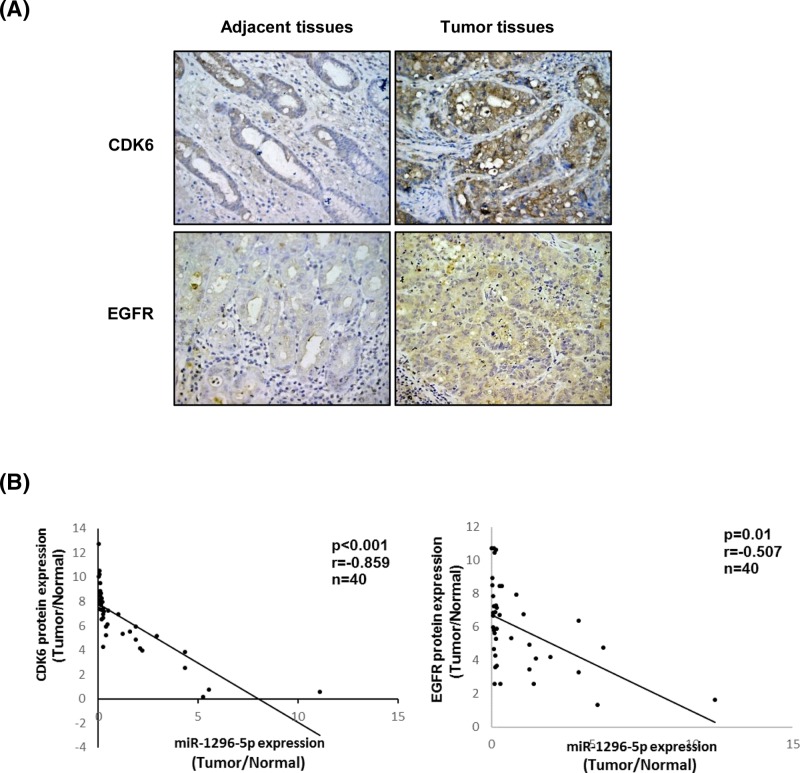
Figure 7. EGFR and CDK6 are down-regulated in GC and negatively correlated with miR-1296-5p.
(A) Representative images from immunohistochemical staining of CDK6 and EGFR in GC and matched adjacent normal tissues. (B) Correlation between miR-1296-5p expression levels and CDK6 and EGFR protein expression levels in paired normal/tumor GC tissue samples.

