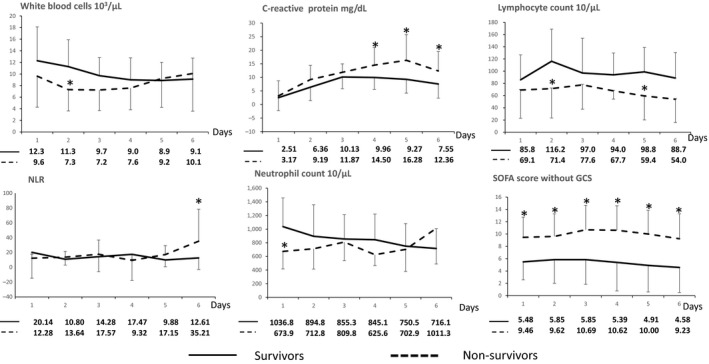
Figure 1.

Comparison of white blood cell count, C‐reactive protein levels, lymphocyte count, neutrophil count, neutrophil–lymphocyte ratio (NLR) and Sequential Organ Failure Assessment (SOFA) scores between survivor (solid line) and non‐survivor (broken line) outcome groups of Japanese patients with coma after cardiac arrest (n = 46). The values of each point are shown below the graphs. The average of survivors is shown in the upper line of values; the average of non‐survivors is shown in the lower line of values. Whiskers in the graphs indicate standard deviation. SOFA score excluded Glasgow Coma Scale (GCS) score. *P < 0.05 compared with survivors.
