
Figure 4.
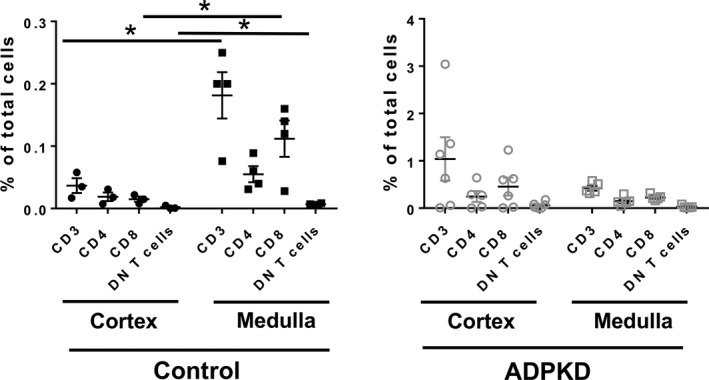
Influx of T cells to ADPKD kidneys abrogates normal polarity of T cell distribution in medulla versus cortex. The number of T cells and their subsets in the cortex versus medulla from control (left panel; cortex‐ black circles, medulla‐ black squares) and ADPKD kidneys (right panel; cortex‐gray circles; medulla‐gray squares;) is shown as a percentage of total kidney cells. *P < 0.05