
Figure 5.
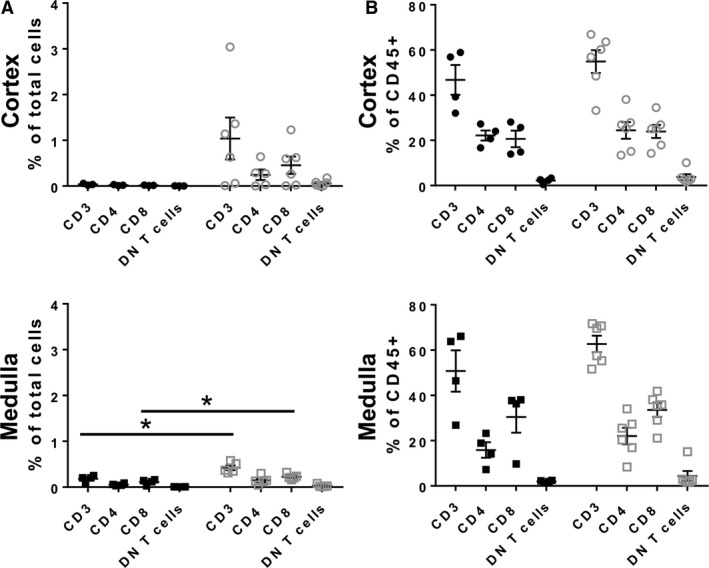
T cell accumulation is increased in renal medulla from ADPKD patients. (A) The numbers of T cells and their subsets in the cortex and medulla were determined by flow cytometry and are shown as a percentage of total kidney cells (black circles‐control cortex, gray circles‐ADPKD cortex; black squares‐ control medulla, gray squares‐ ADPKD medulla; *P < 0.05). (B) ADPKD had no effects on the proportion of T cells and their subsets as a percentage of CD45+ cells.