-
A
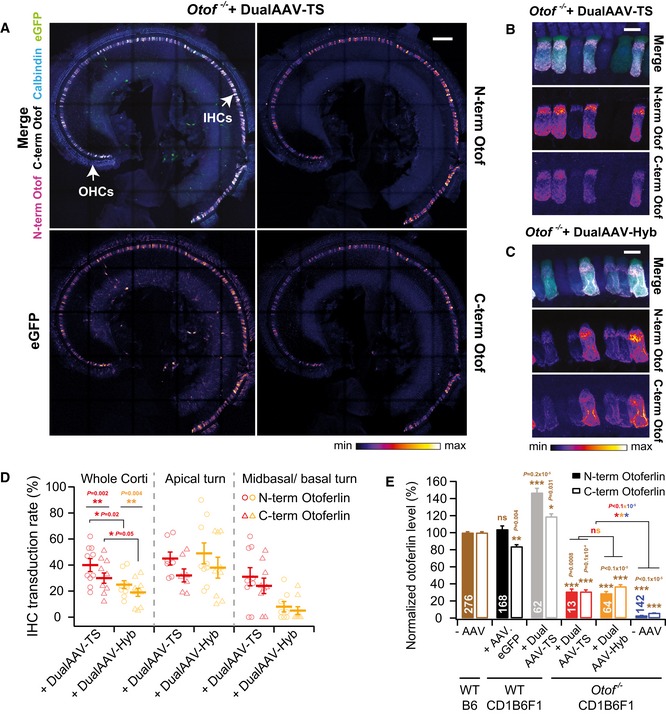
Low magnification views of a CD1‐Otof
−/− organ of Corti (P23)‐transduced with otoferlin dual‐AAV‐TS vectors. IHCs: inner hair cells, OHCs: outer hair cells.
-
B, C
High magnification views of CD1B6F1‐
Otof
−/− IHCs transduced with otoferlin dual‐AAV‐TS (P26) (B) and dual‐AAV‐Hyb (P26) (C) vectors. Individual eGFP and otoferlin immunostainings are depicted as color lookup tables in (A‐C) with warmer colors representing higher pixel intensities. See Fig
EV3 for comparison to wild‐type IHCs.
-
D
Percentage of N‐ and C‐terminal otoferlin labeled IHCs in dual‐AAV‐TS (n = 10 mice)‐ and dual‐AAV‐Hyb (n = 9 mice)‐injected CD1B6F1‐Otof
−/− mice (P18–30).
-
E
Average N‐terminal and C‐terminal otoferlin immunofluorescence levels in dual‐AAV‐transduced Otof
−/− and wild‐type IHCs (P23–30). Otoferlin levels were normalized to immunofluorescence levels in non‐transduced B6 wild‐type IHCs for each antibody separately.
Data information: In (A–C), maximum intensity projections of confocal optical sections. Scale bars: 100 μm (A), 10 μm (B, C). In (D), individual animals are depicted with open symbols. In (E), the number of quantified IHCs is indicated inside the bars. In (D, E), data are displayed as mean ± s.e.m., ns
P > 0.05; *
P ≤ 0.05; **
P ≤ 0.01;***
P ≤ 0.001, [Wilcoxon matched‐pair signed rank test (D), unpaired t‐test with Welch's correction (D), and Kruskal–Wallis test followed by Dunn's multiple comparison test (E)].

