-
A
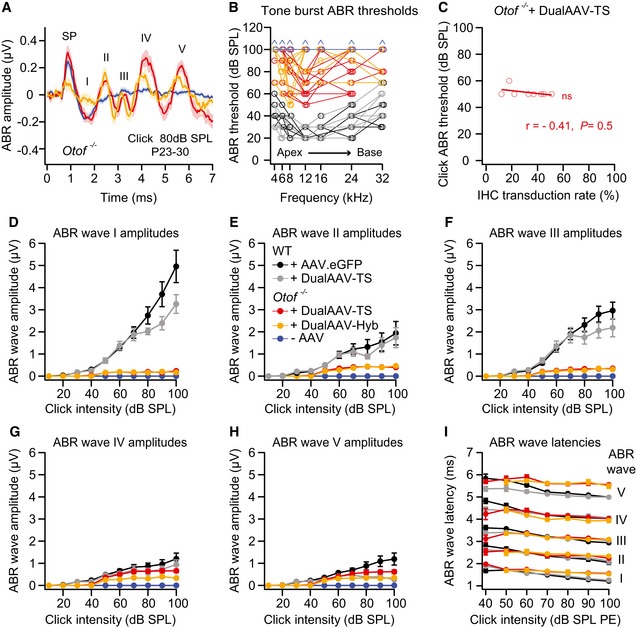
Average ABR waves evoked by 80 dB SPL click sound stimuli in otoferlin dual‐AAV‐injected compared to non‐injected deaf CD1B6F1 Otof
−/− mice. SP: summating potential.
-
B
Tone burst ABR thresholds of individual otoferlin dual‐AAV‐treated Otof
−/− mice compared to non‐treated Otof
−/− and wild‐type control animals. Animals with thresholds exceeding the maximum loudspeaker output of 90 dB SPL were set to 100 dB SPL (arrows). Apical and basal cochlear turns are indicated as Apex and Base, respectively.
-
C
ABR click sound thresholds of individual dual‐AAV‐TS injected CD1B6F1‐
Otof
−/− animals (
n = 8 mice; from Fig
3C) plotted against their full‐length otoferlin IHC transduction rates (from Fig
1D, C‐term otoferlin). r: correlation coefficient.
-
D–H
ABR wave I (D), wave II (E), wave III (F), wave IV (G), and wave V (H) amplitudes, calculated as the difference between the local maximum and the subsequent local minimum, at different click sound intensities in otoferlin dual‐AAV‐injected and non‐injected CD1B6F1‐Otof
−/− mice compared to AAV2/6.eGFP and dual‐AAV‐TS injected control CD1B6F1 wild‐type (WT) animals. SPL: sound pressure level.
-
I
ABR wave I‐V latencies at different click sound intensities in otoferlin dual‐AAV‐injected Otof
−/− and injected CD1B6F1 wild‐type control mice. PE: peak equivalent.
Data information: In (A–I), age of analyzed animals: P23–30. In (A, D–I), number of analyzed mice: CD1B6F1 wild‐type animals (+AAV.eGFP:
n = 12 mice, dualAAV‐TS:
n = 6 mice) and CD1B6F1‐
Otof
−/− animals (dualAAV‐TS:
n = 17 mice, dualAAV‐Hyb:
n = 8 mice, ‐AAV:
n = 38 mice). In (B), number of analyzed mice is the same as for (D–I) except: CD1B6F1‐
Otof
−/− animals (dualAAV‐TS:
n = 16 mice). In (B, C), individual animals are depicted with open symbols. In (A, D–I), data are represented as mean ± s.e.m. In (C), 0.5 >
r > −0.5 no correlation (Spearman correlation test).

