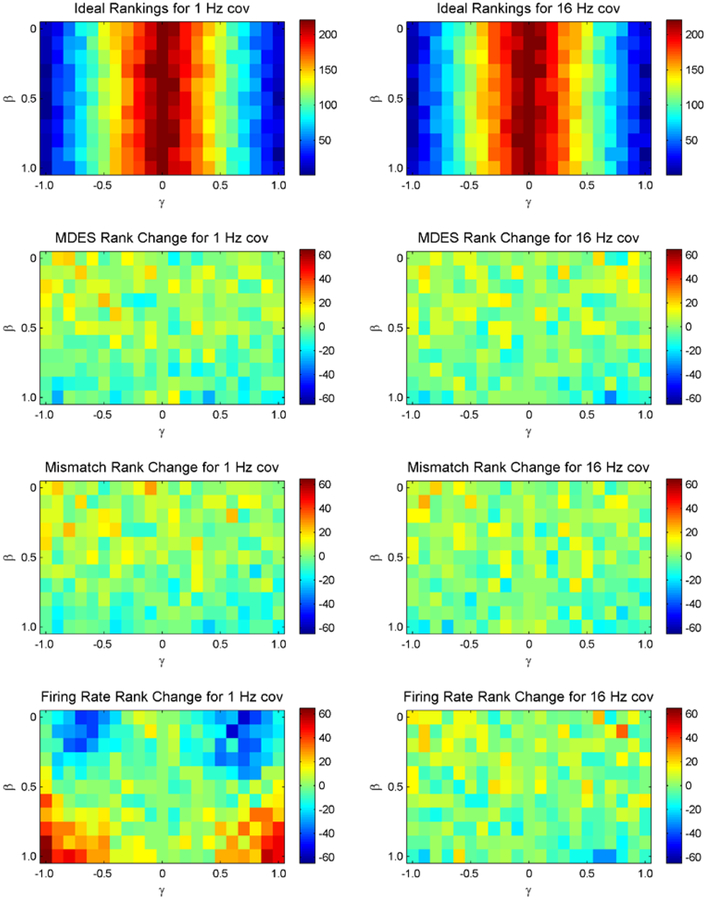
Figure 3.
Rankings across model parameters based on the change point detection ideal (row 1) along with differences between ideal rankings compared to MDES rankings (row2), mismatched MDES rankings (row 3) or firing rate rankings (row 4). The left column corresponds to rankings from intrinsic covariates of 1 Hz while the right column corresponds to rankings from 16 Hz. The lower values (blue) correspond to better rankings while the higher numbers (red) correspond to worse rankings. This means blue relates to the best rankings in the ideal standard. In the bottom three comparison graphs, green corresponds to similar rankings. The ranking for γ = 0 is not calculated and is just set to 221(worst ranking) in order to have a continuous axis.

