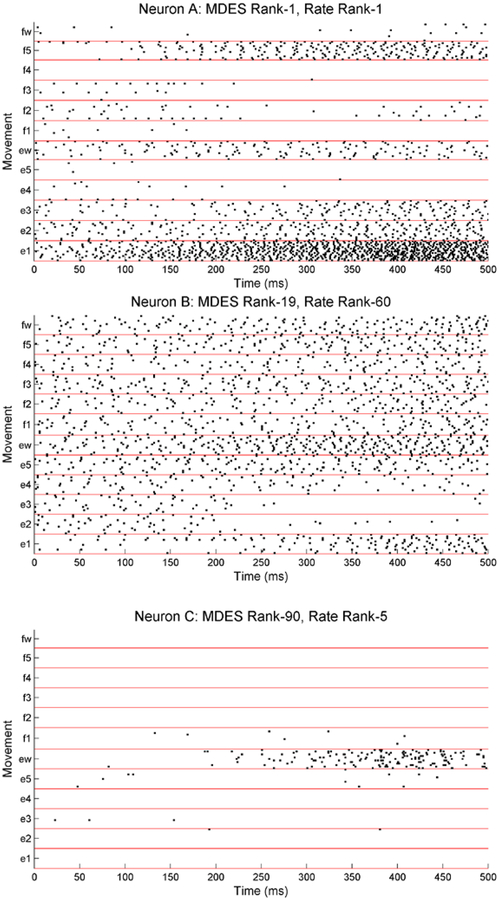
Figure 8.
Raster plots with movement onset at 250 ms for three neurons as indicated by the highlighted neurons in Figure 6. Neuron A shows very distinct firing rate activity across most movements and thus ranks well both in MDES and in firing rate. Neuron B shows a much more homogenous firing rates across movements but has distinct history dependencies (not shown) and is able to rank well in MDES despite ranking poorly in firing rate. Lastly, neuron C only shows activity for the ‘ew’ movement. Since the other movements are virtually indistinguishable, the neuron ranks poorly in MDES despite ranking well in firing rate.

