
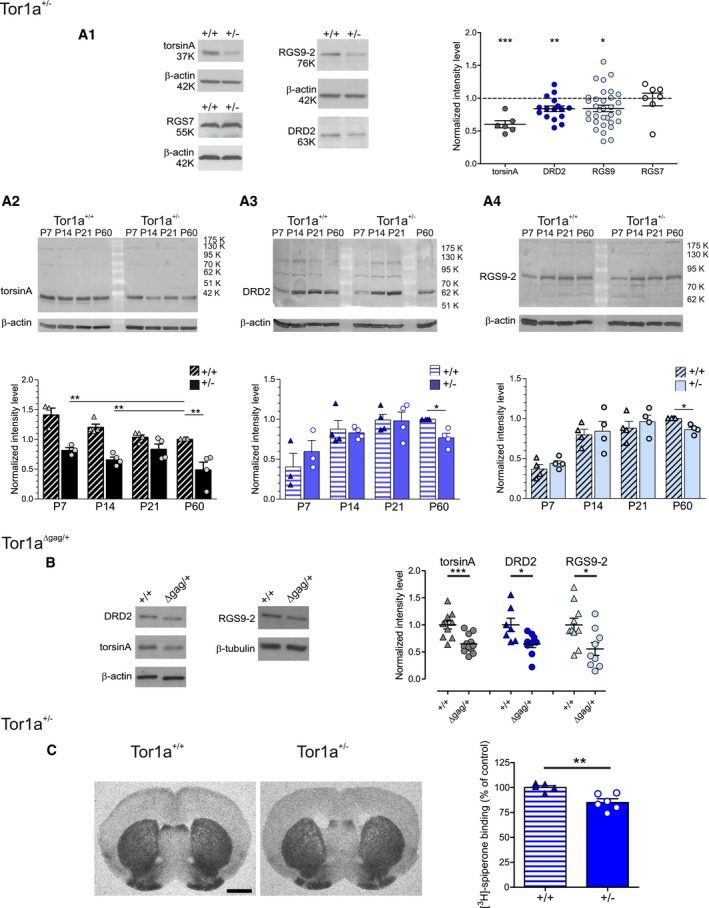
Figure 1. Striatal levels of DRD2 and RGS9‐2 are reduced in the Tor1a +/− and Tor1a ∆gag/+ DYT1 dystonia mouse models.
-
A(A1) Representative WBs showing DRD2 and RGS9‐2 downregulation in adult (P60–P90) Tor1a +/− (+/−) striata, characterized by a reduced torsinA protein level with respect to Tor1a +/+ (+/+) littermates. The striatal level of RGS7 is unchanged. The dot plot shows Tor1a +/− data, normalized to Tor1a +/+ controls of the same experiment. TorsinA: Tor1a +/+ N = 7, Tor1a +/− N = 6, t‐test ***P = 0.0003; DRD2: Tor1a +/+ N = 18, Tor1a +/− N = 16, t‐test **P = 0.0029; RGS9‐2: Tor1a +/+ N = 32, Tor1a +/− N = 33, t‐test *P = 0.0115; RGS7: Tor1a +/+ N = 7, Tor1a +/− N = 7, t‐test P = 0.8721. WB quantification data, expressed as the ratio of protein vs. loading control intensity level, are normalized to the wild‐type samples of the same experiment. (A2–A4) Time‐course of changes in torsinA, DRD2, and RGS9‐2 striatal levels along postnatal development. Summary plot data are normalized to the Tor1a +/+ P60 sample of each independent experiment. (A2) TorsinA level is significantly reduced in mutants throughout the developmental period considered (P7 N = 3; P14–P60 N = 4; one‐way ANOVA P < 0.0001 and Bonferroni's multiple comparison test **P < 0.01 at P7, P14, and P60). (A3, A4) DRD2 and RGS9‐2 levels show parallel courses, with a similar increase from P7 to P21 in Tor1a +/+ as well as Tor1a +/− striatal lysates (P7: DRD2 N = 3, RGS9‐2 N = 4; P14–P21 N = 4; one‐way ANOVA with Bonferroni's multiple comparison test P > 0.05). At P60, a simultaneous reduction of DRD2 and RGS9‐2 levels is observed in Tor1a +/− striatal lysates (N = 4; Tor1a +/− one‐sample t‐test DRD2: *P = 0.0250, RGS9‐2: *P = 0.0175). WB quantification data, expressed as the ratio of protein vs. loading control intensity level, are normalized to the wild‐type P60 sample of the same experiment. Mean ± SEM is represented in the graphs.
-
BRepresentative WB images and the dot plot show downregulation of torsinA, DRD2, and RGS9‐2 striatal levels also in adult P60–P90 Tor1a ∆gag/+ (∆gag/+) mice. TorsinA: Tor1a +/+ N = 10, Tor1a Δgag/+ N = 12, t‐test ***P = 0.0006; DRD2: Tor1a +/+ N = 7, Tor1a Δgag/+ N = 9, t‐test *P = 0.0183; RGS9‐2: Tor1a +/+ N = 10, Tor1a Δgag/+ N = 9, t‐test *P = 0.0192. WB quantification data, expressed as the ratio of protein vs. loading control intensity level, are normalized to the wild‐type samples of the same experiment. Mean ± SEM is represented in the graph.
-
CLeft: Representative image of coronal striatal slices of fresh‐frozen brains of wild‐type and Tor1a +/− mice probed with the DRD2 radioligand 3H‐spiperone. Scale bar 1.5 mm. Right: Graph showing DRD2 binding density in Tor1a +/− striatal sections, obtained from the densitometric quantification analysis, expressed as percentage variation compared to control animals. Tor1a +/+ N = 5, Tor1a +/− N = 6, t‐test **P = 0.0042. Mean ± SEM is represented.
Source data are available online for this figure.