
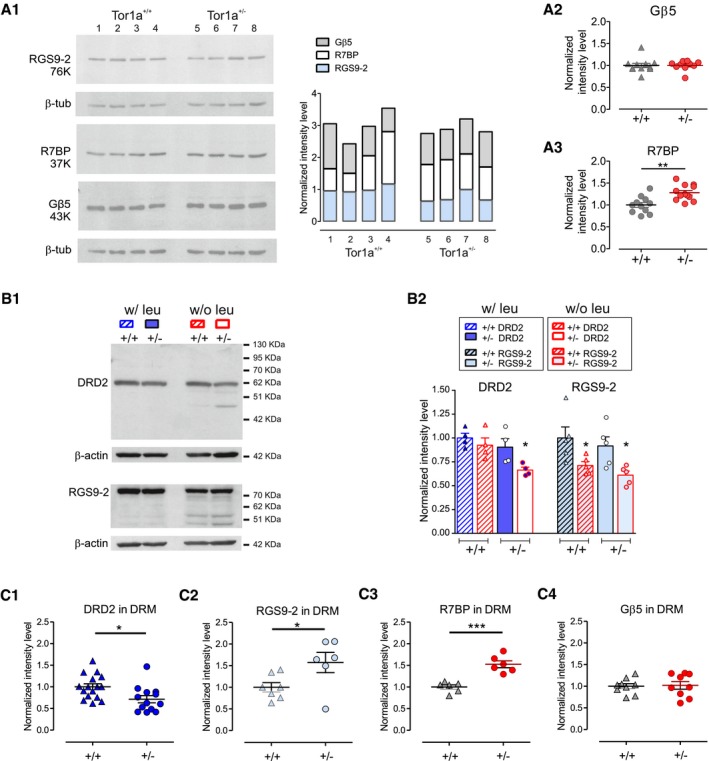
Figure 2. DRD2 downregulation is mediated by lysosomal degradation.
-
A(A1) Representative WB of RGS9‐2, R7BP, and Gβ5 proteins on four Tor1a +/+ and four Tor1a +/− striatal lysates. The bar histogram on the right shows the quantification of the three proteins in each sample. (A2) Dot plot showing that Gβ5 striatal levels are unchanged in Tor1a +/− mice (Tor1a +/+ N = 11, Tor1a +/− N = 10, Mann–Whitney test P = 0.2453). (A3) Conversely, the level of the R7 binding protein R7BP is increased in Tor1a +/− striatum (Tor1a +/+ N = 12, Tor1a +/− N = 12, t‐test **P = 0.0014). Values are represented as ratio of protein vs. loading control intensity level, normalized to the mean of Tor1a +/+ control values of the same experiment. Mean ± SEM is represented.
-
B(B1) Representative WB of lysates of Tor1a +/+ and Tor1a +/− dorsal striatum slices incubated for 5 h in the presence (w/ leu) or absence (w/o leu; contralateral striatum) of the protease inhibitor leupeptin. Samples showing enhanced degradation of DRD2 and/or RGS9‐2 proteins show additional bands at lower molecular weight. (B2) Summary plot reporting mean ± SEM of RGS9‐2 and DRD2 protein level values, expressed as the ratio of protein vs. loading control intensity level, normalized to the value of the Tor1a +/+ w/leu sample measured in the same experiment. DRD2: Tor1a +/+ N = 4, t‐test P = 0.4376; Tor1a +/− N = 4, t‐test *P = 0.0427; RGS9‐2: Tor1a +/+ N = 5, t‐test *P = 0.0464; Tor1a +/− N = 5, t‐test *P = 0.0190.
-
CDot plots showing DRD2, RGS9‐2, R7BP, and Gβ5 protein levels measured in striatal detergent‐resistant‐membrane (DRM) preparations from Tor1a +/− (+/−) and WT (+/+) mice (DRD2: Tor1a +/+ N = 16, Tor1a +/− N = 13, t‐test *P = 0.0129; RGS9‐2: Tor1a +/+ N = 7, Tor1a +/− N = 6, t‐test *P = 0.0396; R7BP: Tor1a +/+ N = 6, Tor1a +/− N = 6, t‐test ***P = 0.0002; Gβ5: Tor1a +/+ N = 9, Tor1a +/− N = 9, t‐test P = 0.8461). Values are reported as ratio of protein vs. PSD‐95 intensity level, normalized to the mean value of the Tor1a +/+ samples measured in the same experiment. Mean ± SEM is represented.
Source data are available online for this figure.