
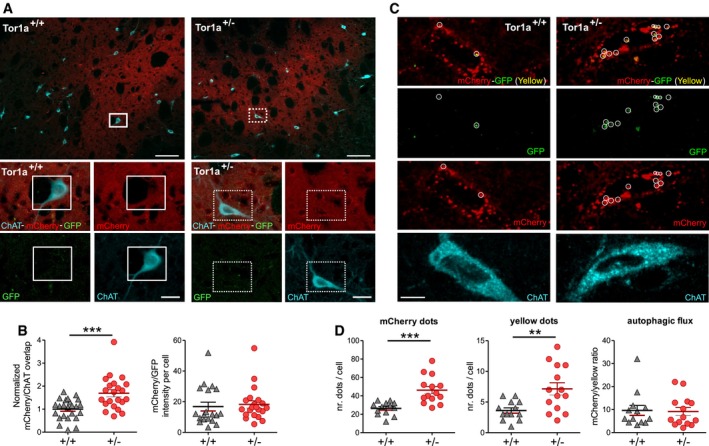
Figure 5. The AAV2/9‐mCherry‐GFP‐LC3 reporter indicates upregulation of the autophagy pathway in ChIs.
-
ATop: Low‐magnification merged confocal images of coronal striatal sections showing ChAT‐labeled (cyano) ChIs in the area of mCherry fluorescence (red) indicating viral infection. Scale bar = 100 μm. Bottom: Higher magnification images of the ChIs identified by the white box in the upper images show viral‐induced expression of mCherry and GFP signal. Scale bar = 20 μm.
-
BThe mCherry/ChAT overlap is increased in ChIs from Tor1a +/− mice (Tor1a +/+ n = 24 cells, Tor1a +/− n = 22 cells, N = 8 mice/genotype, t‐test ***P = 0.0005), but the mCherry/GFP fluorescence ratio indicated that the LC3 flux was unchanged (Tor1a +/+ n = 19 cells, Tor1a +/− n = 21 cells, N = 8 mice/genotype, Mann–Whitney test P = 0.2334).
-
C, D(C) Merged and split channel confocal images (scale bar = 10 μm) of representative Tor1a +/+ and Tor1a +/− ChIs showing red dots and yellow puncta (indicated by white circles), quantified in (D): red dots: Tor1a +/+ n = 13 cells, Tor1a +/− n = 14 cells, t‐test ***P = 0.0003; yellow dots: Tor1a +/+ n = 13 cells, Tor1a +/− n = 14 cells, t‐test **P = 0.0048, N = 5 mice/genotype. Measurement of the mCherry/yellow dots ratio indicated that the autophagic flux was not altered (Tor1a +/+ n = 13 cells; Tor1a +/− n = 14 cells, Mann–Whitney test P = 0.8842).