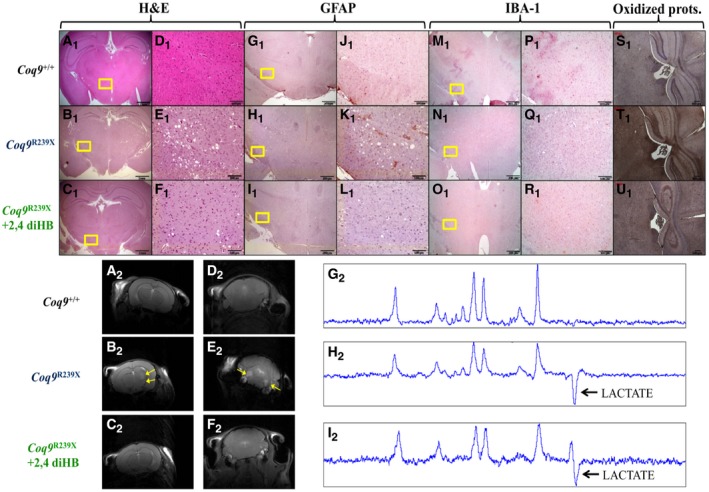
A–U(A1–F1) H&E stain in the diencephalon of Coq9
+/+ mice (A1 and D1), Coq9
R239X mice (B1 and E1), and Coq9
R239X mice after β‐RA treatment (C1 and F1). (G1–L1) Anti‐GFAP stain in the diencephalon of Coq9
+/+ mice (G1 and J1), Coq9
R239X mice (H1 and K1), and Coq9
R239X mice after β‐RA treatment (I1 and L1). (M1–R1) Anti‐Iba1 stain in the diencephalon of Coq9
+/+ mice (M1 and P1), Coq9
R239X mice (N1 and Q1), and Coq9
R239X mice after β‐RA treatment (O1 and R1). (S1–U1) Protein oxidation in the diencephalon of Coq9
+/+ mice (S1), Coq9
R239X mice (T1), and Coq9
R239X mice after β‐RA treatment (U1). (A2–C2) Magnetic Resonance Images of the diencephalon of Coq9
+/+ mice (A2), Coq9
R239X mice (B2), and Coq9
R239X mice after β‐RA treatment (C2). (D2–F2) Magnetic Resonance Images of the pons of Coq9
+/+ mice (D2), Coq9
R239X mice (E2), and Coq9
R239X mice after β‐RA treatment (F2). (G2–I2) Lactate peak in the brain of Coq9
+/+ mice (G2), Coq9
R239X mice (H2), and Coq9
R239X mice after β‐RA treatment (I2). Scale bars: 1 mm (A1–C1); 100 μm (D1–F1); 200 μm (G1–I1); 100 μm (J1–L1); 200 μm (M1–O1); 100 μm (P1–R1); 100 μm (S1–U1). The yellow arrows indicated the areas of increased T2 signal, which is characteristic of lesions in specific brain areas.

