-
A
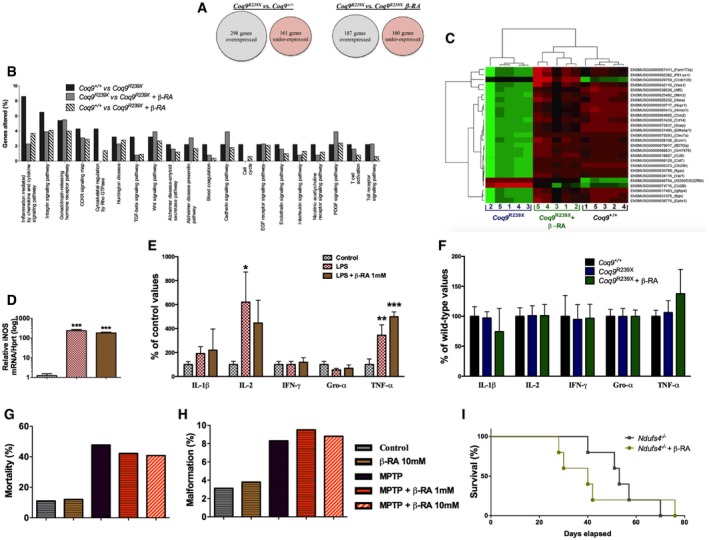
Global differences in the levels of gene expression between experimental groups.
-
B
Only pathways with more than one gene significantly altered in Coq9
R239X compared to Coq9
+/+ mice are considered for this figure. The y‐axis represents the percentage of genes corresponding to a pathway in the sample of genes whose expression level is significantly altered in a comparison between mice samples.
-
C
Heatmap showing the comparative landscape of the expression level per sample of the 27 genes whose expression was altered by the mutation and normalized by the β‐RA treatment. The column numbers correspond to the different samples and the row names are gene codes composed of the ENSEMBL gene ID and the gene symbol (between parentheses). The green means comparatively higher, red means comparatively lower, and black means no difference in expression level (n = 5 for each group).
-
D
iNOS expression levels in RAW cells after stimulation with LPS (n = 3 for each group).
-
E
Cytokine levels in the culture supernatant of RAW cells after stimulation with LPS (n = 3 for each group).
-
F
Cytokine levels in the brainstem of Coq9
+/+ mice, Coq9
R239X mice, and Coq9
R239X mice treated with β‐RA (n = 7 for each group).
-
G, H
Mortality rate (G) and (H) percentage of malformations in zebrafish embryos treated with MPT and the effect of β‐RA treatment.
-
I
Survival curve of
Ndufs4 knockout mice and
Ndufs4 knockout mice treated with β‐RA [Log‐rank (Mantel‐Cox) test;
n = 5 for each group; see
Appendix Table S3 for exact
P‐values].
Data information: Data in panels (D–F) are expressed as mean ± SD. *
P < 0.05; **
P < 0.01; ***
P < 0.001; LPS or LPS + β‐RA versus control.
+
P < 0.05; LPS or LPS + β‐RA versus control (one‐way ANOVA with a Tukey's
post hoc test; see
Appendix Table S3 for exact
P‐values).

