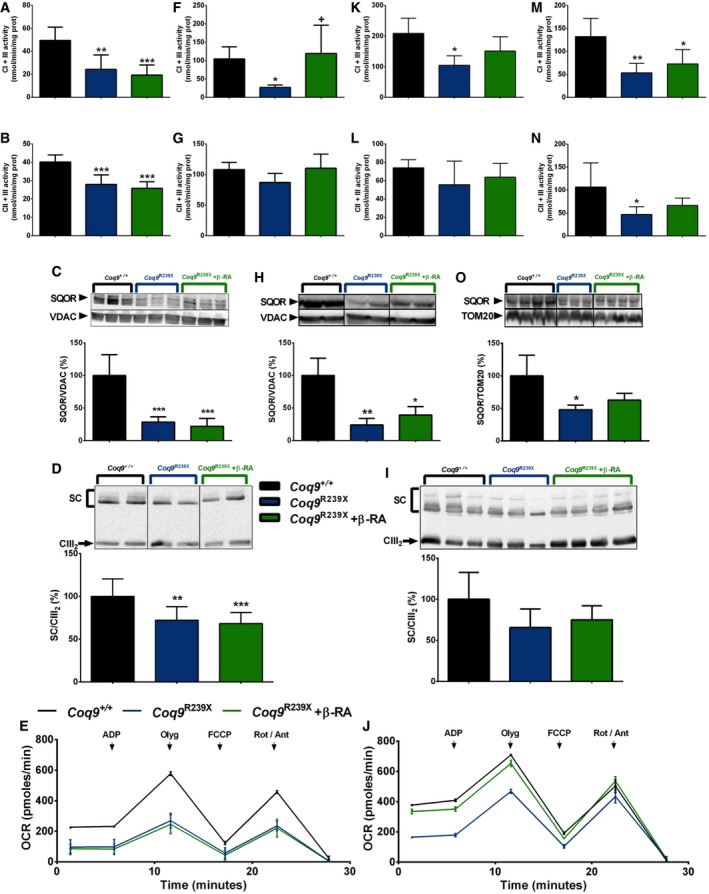
Figure 4. Tissue‐specific differences in mitochondrial function after β‐RA treatment in Coq9 R239X mice.

-
A–O(A, F, K, M) CoQ‐dependent Complex I+III activities in brain (A) and kidneys (F), skeletal muscle (K), and heart (M). (A): Coq9 +/+, n = 5; Coq9 R239X, n = 6; Coq9 R239X after β‐RA treatment, n = 7. (F): Coq9 +/+, n = 4; Coq9 R239X, n = 6; Coq9 R239X after β‐RA treatment, n = 4. (K): Coq9 +/+, n = 3; Coq9 R239X, n = 6; Coq9 R239X after β‐RA treatment, n = 3. (M): Coq9 +/+, n = 5; Coq9 R239X, n = 6; Coq9 R239X after β‐RA treatment, n = 6). (B, G, L, N) CoQ‐dependent Complex II+III activities in brain (B) and kidneys (G), skeletal muscle (L) and heart (N). (B): Coq9 +/+, n = 5; Coq9 R239X, n = 6; Coq9 R239X after β‐RA treatment, n = 7. (G): Coq9 +/+, n = 5; Coq9 R239X, n = 6; Coq9 R239X after β‐RA treatment, n = 6. (L): Coq9 +/+, n = 5; Coq9 R239X, n = 6; Coq9 R239X after β‐RA treatment, n = 7. (N): Coq9 +/+, n = 6; Coq9 R239X, n = 6; Coq9 R239X after β‐RA treatment, n = 6. (C, H, O) Representative Western blot and quantitation of Western blot bands of SQOR in mitochondrial fractions of brain (C) and homogenates extracts from kidneys (H) and heart (O). (C): Coq9 +/+, n = 6; Coq9 R239X, n = 6; Coq9 R239X after β‐RA treatment, n = 6. (H): Coq9 +/+, n = 4; Coq9 R239X, n = 3; Coq9 R239X after β‐RA treatment, n = 3. (O): Coq9 +/+, n = 4; Coq9 R239X, n = 3; Coq9 R239X after β‐RA treatment, n = 4. (D, I) Blue‐native gel electrophoresis (BNGE) followed by C‐III immunoblotting analysis of mitochondrial supercomplexes in brain (D) and kidneys (I). (D): Coq9 +/+, n = 9; Coq9 R239X, n = 10; Coq9 R239X after β‐RA treatment, n = 11. (I): Coq9 +/+, n = 5; Coq9 R239X, n = 6; Coq9 R239X after β‐RA treatment, n = 7. (E, J) Mitochondrial oxygen consumption rate (represented as State 3o, in the presence of ADP and substrates) in brain (E) and kidneys (J). The data represent three technical replicates and the figures are representative of three biological replicates. Coq9 +/+ mice, Coq9 R239X mice, and Coq9 R239X mice after β‐RA treatment were included in all graphs. Data are expressed as mean ± SD. *P < 0.05; **P < 0.01; ***P < 0.001; Coq9 R239X or Coq9 R239X after β‐RA treatment versus Coq9 +/+. + P < 0.05; Coq9 R239X versus and Coq9 R239X after β‐RA treatment (one‐way ANOVA with a Tukey's post hoc test; see Appendix Table S4 for exact P‐values).
Source data are available online for this figure.
