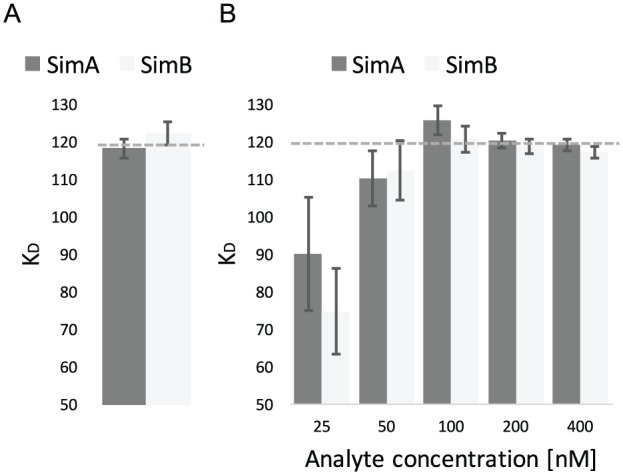
Figure 2.

Analysis of simulated datasets. A sample dataset consisting of the 2 subdatasets with 5 binding curves each (SimA and SimB) was analyzed using Anabel’s Evaluation Method 1 (Graph A, kobs linearization) and Evaluation Method 2 (Graph B, single-curve analysis). All KD values are displayed in nM and error bars show the standard deviation of the KD values. The dotted lines show the true simulated KD value of 120 nM.
