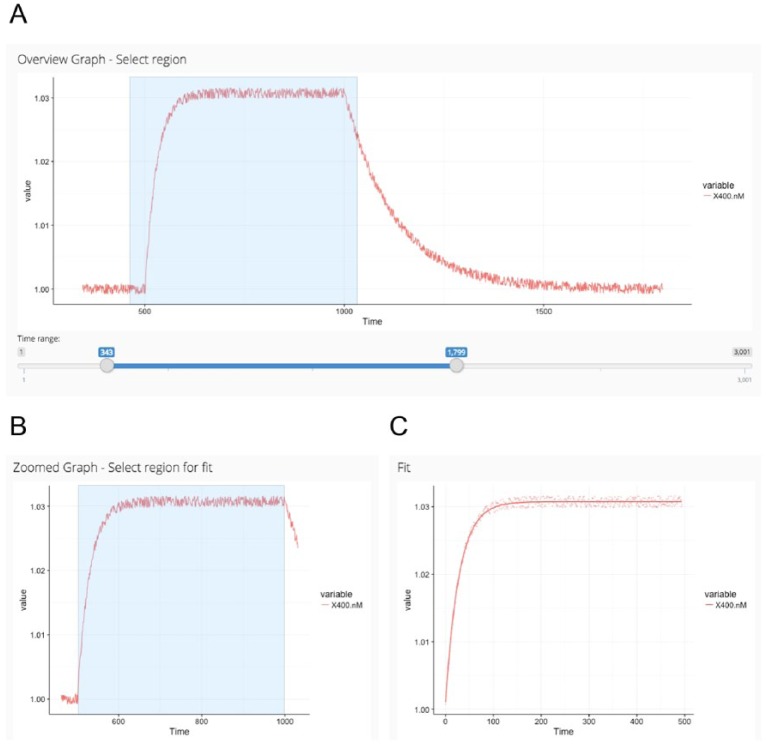
Figure 3.
First steps in Anabel. After data upload in Anabel, an overview graph is calculated (A) from which a zoomed region needs to be selected (rectangle). The selected region from A is displayed in the “zoomed graph” (B). Thereafter, the selected data points of the “zoomed graph” (rectangle) are used for the fit (C). All plots are screenshots from the actual Anabel software.

