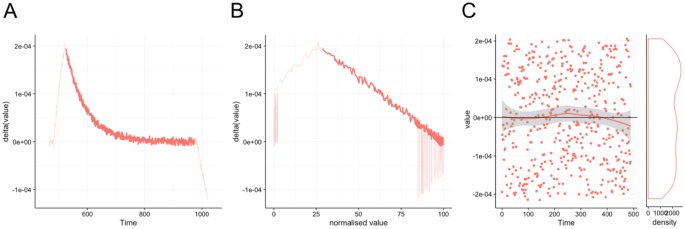
Figure 4.
Assisting analysis graphs. The deviation plot (A), the self-exponential plot (B), and the residual plot (C) form Anabel’s 3 assisting analysis graphs. The actual fitted region of the binding curves is highlighted, whereas peripheral regions not used for the actual fit are displayed in a lighter color. All 3 graphs help the experienced user to exclude binding artifacts. Plots are screenshots from the actual Anabel software.

