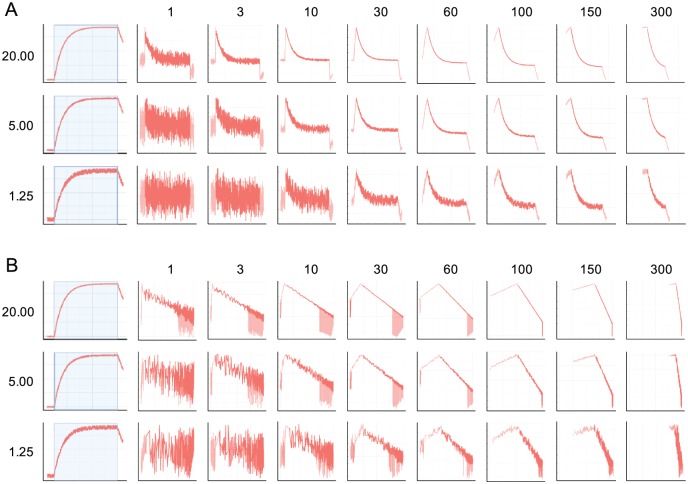
Figure 5.
Influence of the curve smoothing parameter on the assisting analysis graphs. The influence of signal-to-noise values (1.25-20) in combination with different curve smoothings (1 = no curve smoothing; 300 = maximum curve smoothing) on the deviation plot (A) and the self-exponential plot (B).

