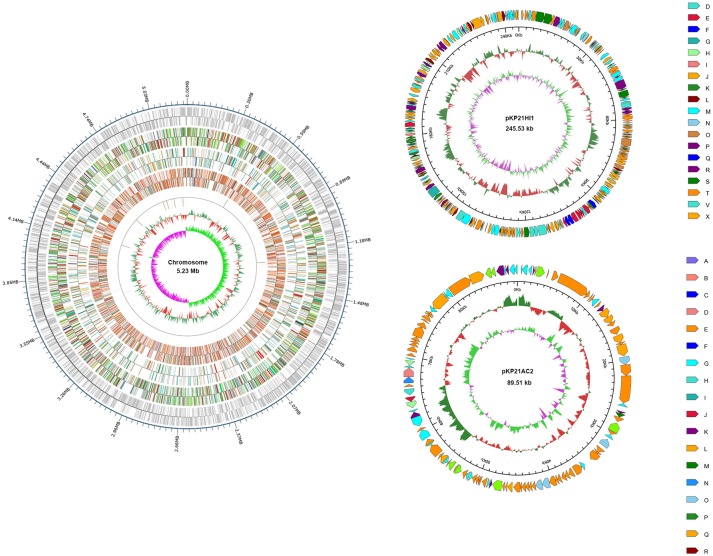
Figure 1.
Genome map of K. pneumoniae 2-1 chromosome and plasmids. For chromosome, from outside to inside, each ring represents encoding genes, COG, KEGG, GO, ncRNA, GC content, and genomic GC skew value. For plasmids, from outside to inside, each ring represents COG, GC content, and genomic GC skew value. Different color represents different annotation.

