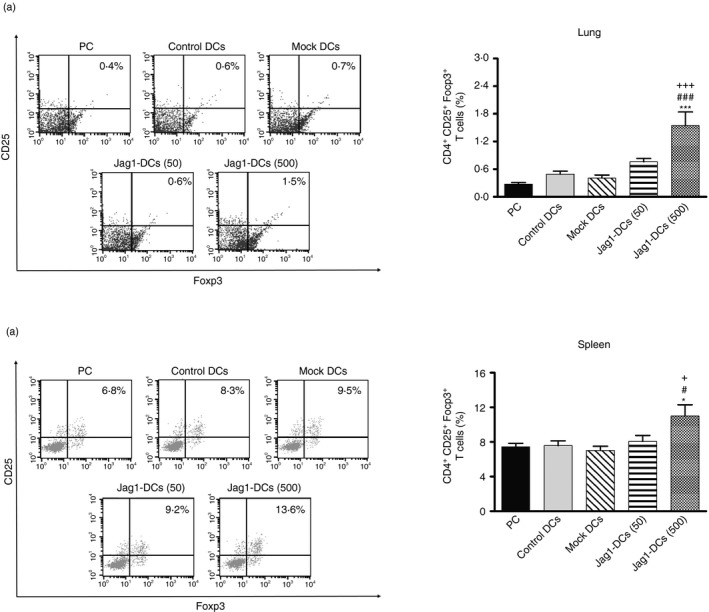
Figure 6.

Jag1‐dendritic cell (DC) treatment enhanced the generation of Foxp3+ regulatory T (Treg) cells. The percentage of Foxp3+ Treg cells in (a) the lungs and (b) spleen. Lung and spleen cells from each group were analyzed by flow cytometry. Representative dot plots show expressions of CD25 and Foxp3 by gated CD4+ T cells. The percentage was calculated, and results are expressed as the mean ± SEM of five mice in each group. *P < 0·05, ***P < 0·001 versus the positive control (PC) group. # P < 0·05, ### P < 0·001 versus the control DC group. + P < 0·05, +++ P < 0·001 versus the mock DC group.
