-
A, B
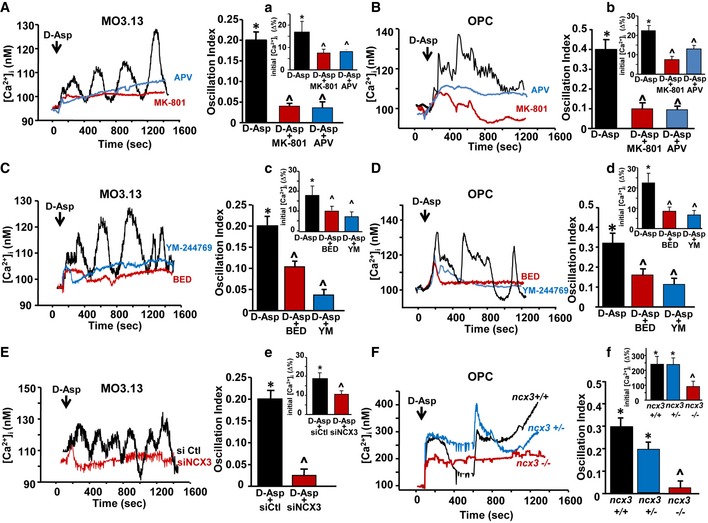
Left panels: Superimposed single‐cell traces representative of the effect of 100 μM D‐Asp on [Ca2+]i detected in MO3.13 cells (A) and primary OPC (B) in the absence or in the presence of 10 μM MK‐801 or 150 μM APV. Right panels: Quantification of the oscillation index in MO3.13 cells (A) and primary OPC (B) in the absence or in the presence of 10 μM MK‐801 or 150 μM APV. (a, b) Quantification of the initial [Ca2+]i increase elicited by D‐Asp measured as Δ% of peak versus basal values in the absence or in the presence of 10 μM MK‐801 or 150 μM APV, both in MO3.13 cells (a) and in primary OPC (b). MK‐801 and APV were preincubated 10 min before registration.
-
C, D
Left panels: superimposed single‐cell traces representative of the effect of 100 μM D‐Asp on [Ca2+]i detected in MO3.13 cells (C) and primary OPC (D) in the absence or in the presence of 30 nM YM‐244769 or 100 nM BED. Right panels: quantification of the oscillation index in MO3.13 cells (C) and primary OPC (D) in the absence or in the presence of 30 nM YM‐244769 or 100 nM BED. (c, d) Quantification of the initial [Ca2+]i increase elicited by D‐Asp measured as Δ% of peak versus basal values in the absence or in the presence of 30 nM YM‐244769 or 100 nM BED, both in MO3.13 cells (c) and in primary OPC (d). YM‐244769 or BED was preincubated 10 min before registration.
-
E
Left: Superimposed single‐cell traces representative of the effect of 100 μM D‐Asp on [Ca2+]i detected in MO3.13 cells in the presence of siCtl or sincx3 silencing. Right: Quantification of the oscillation index in MO3.13 cells in the absence or in the presence of sincx3. (e) Quantification of the initial [Ca2+]i increase elicited by D‐Asp and measured as Δ% of peak versus basal values in the absence or in the presence of sincx3.
-
F
Left: Superimposed single‐cell traces representative of the effect of 100 μM D‐Asp on [Ca2+]i detected in primary OPC obtained from wild‐type ncx3
+/+, heterozygous ncx3
+/−
, and knockout ncx3
−/− mice. Right: Quantification of the oscillation index elicited by D‐Asp in primary mouse OPC obtained from ncx3
+/+, ncx3
+/−, and ncx3
−/− mice. (f) Quantification of the initial [Ca2+]i increase measured as Δ% of peak versus basal values.
Data information: The values represent the mean ± SEM from three independent experimental sessions. Level of significance was determined by using: in (A and a) one‐way ANOVA
P <
0.001 followed by Bonferroni
post hoc test, *
P <
0.05 versus control (basal value),
˄
P <
0.05 versus D‐Asp. Data are reported as mean of 23–30 cells in each group,
n =
3 biological replicates; (B and b) one‐way ANOVA,
P <
0.001 followed by Bonferroni
post hoc test, *
P <
0.05 versus control (basal value),
˄
P <
0.05 versus D‐Asp. Data are reported as mean of 20–23 cells in each group,
n =
3 biological replicates; (C and c) one‐way ANOVA
P <
0.001 followed by Bonferroni
post hoc test, *
P < 0.05 versus control (basal value),
˄
P <
0.05 versus D‐Asp. Data are reported as mean of 19–30 cells in each group,
n =
3 biological replicates; (D and d) one‐way ANOVA
P <
0.001 followed by Bonferroni
post hoc test, *
P <
0.05 versus control (basal value),
˄
P <
0.05 versus D‐Asp. Data are reported as mean of 18–20 cells in each group,
n =
3 biological replicates; (E and e) one‐way ANOVA
P <
0.001 followed by Bonferroni
post hoc test, *
P <
0.05 versus sictl,
˄
P <
0.05 versus D‐Asp + sictl. Data are reported as mean of 25–30 cells in each group,
n =
3 biological replicates; (F and f) one‐way ANOVA
P <
0.001 and
P =
0.003, respectively, followed by Bonferroni
post hoc test, *
P <
0.05 versus basal value,
˄
P <
0.05 versus
ncx3
+/+ and
ncx3
+/−. Data are reported as mean of 10–19 cells in each group,
n =
3 biological replicates. See the exact
P‐values from comparisons tests in
Appendix Table S4.

