-
A
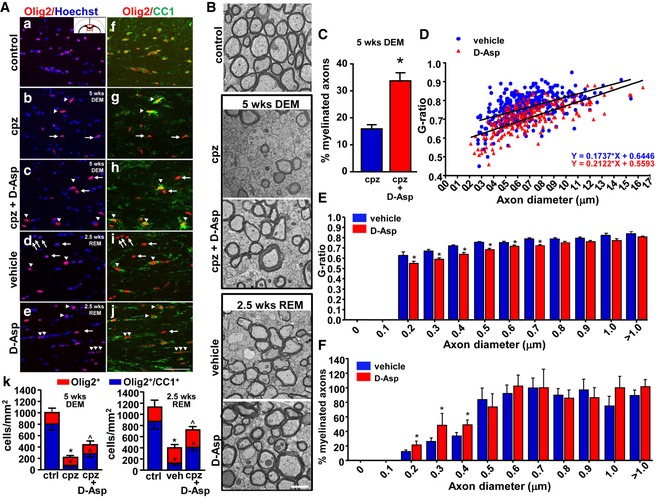
Confocal double immunofluorescence images depicting Olig2+ (a–e) and Olig2+‐CC1+ (f–j) double‐labeled cells in the middle corpus callosum of control, cuprizone‐treated mice at 5 weeks, in the absence (cpz) or in the presence of D‐Asp (cpz + D‐Asp), and 2.5 weeks after cuprizone withdrawal, in the absence (vehicle) or in the presence of D‐Asp (D‐Asp). (k, left panel), Quantitative analysis of Olig2+ cells (red) and Olig2+‐CC1+ (blue) double‐labeled cells in the middle corpus callosum of control, cuprizone‐treated mice, and cuprizone+D‐Asp‐treated mice at 5 weeks. (k, right panel), Quantitative analysis of Olig2+ cells (red) and Olig2+‐CC1+ (blue) double‐labeled cells in the middle corpus callosum of control, vehicle, and D‐Asp‐treated mice 2.5 weeks after cuprizone withdrawal. Arrows point to Olig2+‐CC1+ cells. Arrowheads point to Olig2+‐CC1+ cells. Scale bar in a–j: 50 μm.
-
B
Representative electron microscopy images of middle corpus callosum sections from control mice (control), from cuprizone‐treated mice for 5 weeks in the absence (cpz) or in the presence of D‐Asp (cpz+D‐Asp), and from mice 2.5 weeks after cuprizone withdrawal in the absence (vehicle) or in the presence of D‐Asp (D‐Asp). Scale bars: 1 μm.
-
C
Percentage of myelinated axons in the middle corpus callosum of cuprizone (blue) and cuprizone + D‐Asp‐treated mice (red) for 5 weeks.
-
D
Scatter plot analysis of myelin thickness, expressed as individual G‐ratios against axon diameters, after 2.5 weeks of cuprizone withdrawal in the middle corpus callosum of vehicle (blue circle) or D‐Asp‐treated mice (red triangle). Linear regression was used to indicate the differences between the groups in myelin thickness across the range of axon diameters.
-
E
Histogram analysis displaying the G‐ratio values of myelinated fibers across the range of axon diameters. Data represent the mean ± SEM for at least 100 axons from each group.
-
F
Percentage of myelinated axons after 2.5 weeks of cuprizone withdrawal in the middle corpus callosum of vehicle (blue) or D‐Asp‐treated mice (red). DEM, demyelination; REM, remyelination.
Data information: The values represent the means ± SEM. Level of significance was determined by using: in (A, k) left panel, one‐way ANOVA
P <
0.0001 followed by Newman–Keuls
post hoc test, *
P <
0.05 versus ctrl;
˄
P <
0.05 versus cpz (
n =
3 mice for each group). (A, k) right panel, one‐way ANOVA
P <
0.0001 followed by Newman–Keuls
post hoc test, *
P <
0.05 versus ctrl;
˄P <
0.05 versus vehicle (
n =
3 mice for each group); (C) two‐tailed Student's
t‐test, *
P <
0.05 versus cpz (
n =
4 mice for each group); (E) for each axon diameter group, Student's
t‐test, *
P <
0.05 versus vehicle (
n =
4 mice for each group); (F) for each axon diameter group, Student's
t‐test, *
P <
0.05 versus vehicle (
n =
4 mice for each group). See the exact
P‐values from comparisons tests in
Appendix Table S8.
Source data are available online for this figure.

