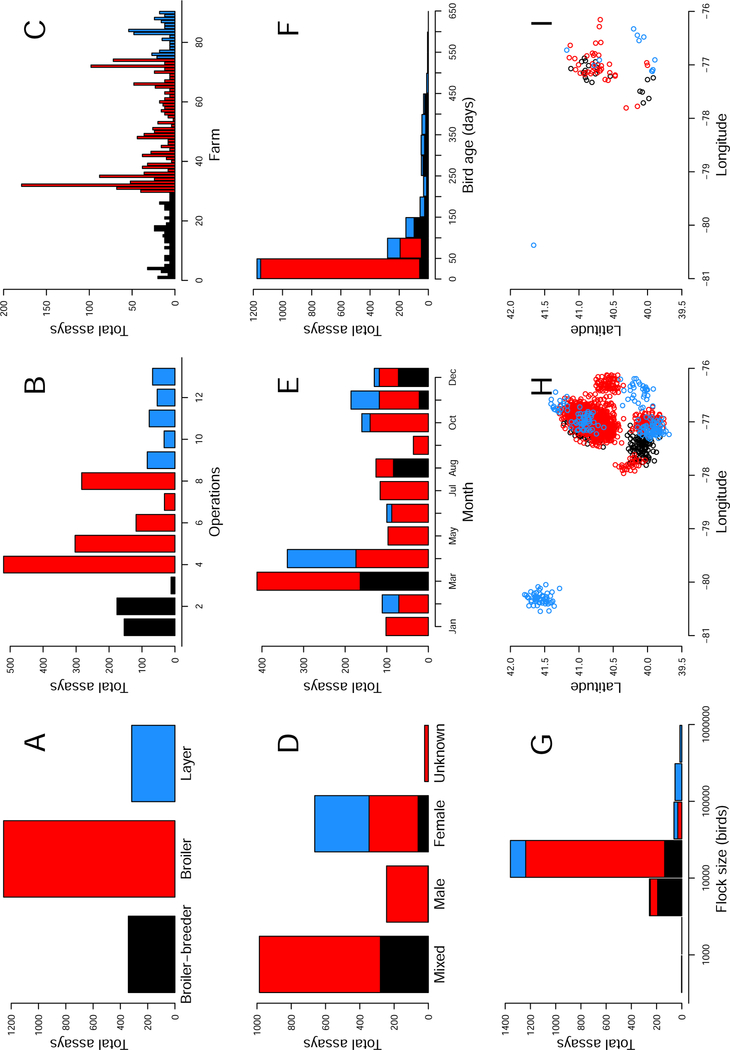
Figure 2:
Summary plots of the cross-sectional data depicting the number of assays that were performed as a function of production type (A), operation (B), farm (C), sex (D), month of the year (E), bird age (F), and flock size (G). For example, in panel B, 520 assays were run for samples collected from operation 4. Also depicted are the approximate locations of origin of each sample (H) and each farm (I). Note that to maintain farm location anonymity, normal random variables with mean 0 and standard deviation 0.1 were added to the points when plotting latitude and longitudes in H and I. In all plots, black color depicts breeder facilities, red color depicts broiler facilities, and blue color depicts layer facilities.

