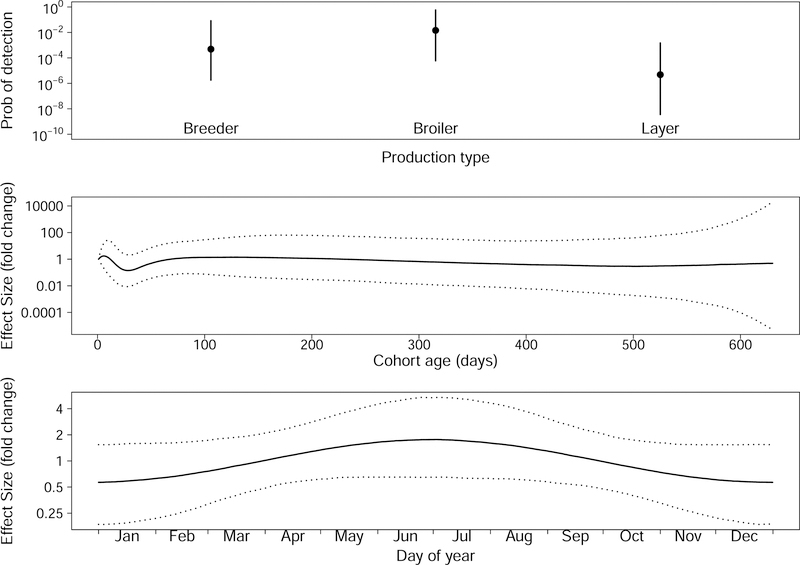
Figure 5:
Effect sizes for fixed effects. The top panel shows the median and 95% credible interval for the three production types. The middle panel shows the median and 95% credible interval for the effect of bird age on the probability of detecting virus in a dust sample. The bottom panel shows the median and 95% credible interval for the effect of collection date on the probability of detecting virus.

