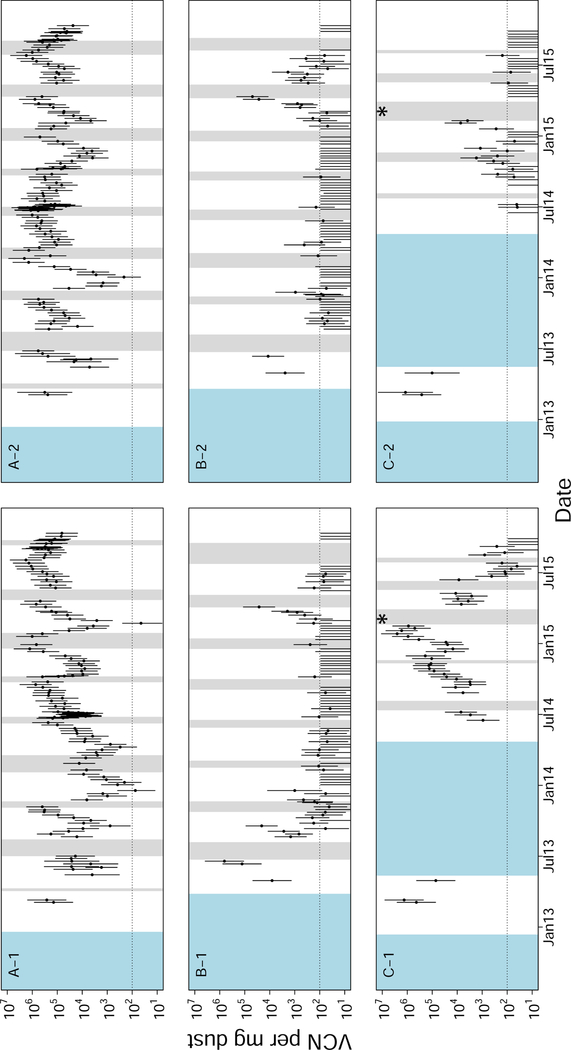
Figure 6:
Longitudinal surveillance data for three broiler farms in Pennsylvania. Each panel is labelled “X-Y”, where “X” gives a unique farm identification, and “Y” gives a house number on that farm such that each two character label is unique. Each of the three farms shown in this figure had two houses. All of these farms began associated with the same operation, but farm “C” changed operations in the middle of our surveillance. The timing of this change is denoted by an asterisk in the plot. All farms followed an “all-in, all-out” policy meaning that houses had discrete periods of rearing and down time. To represent the presence or absence of birds, white intervals cover periods when birds were present, grey intervals cover periods when birds were absent, and blue intervals cover unknown periods. Each point represents the log-mean virus concentration (VCN) for that set of dust samples. Error bars are 95% confidence intervals calculated as explained in Supplement A.15. The dotted horizontal line shows the approximate qPCR limit of detection for a single test.

