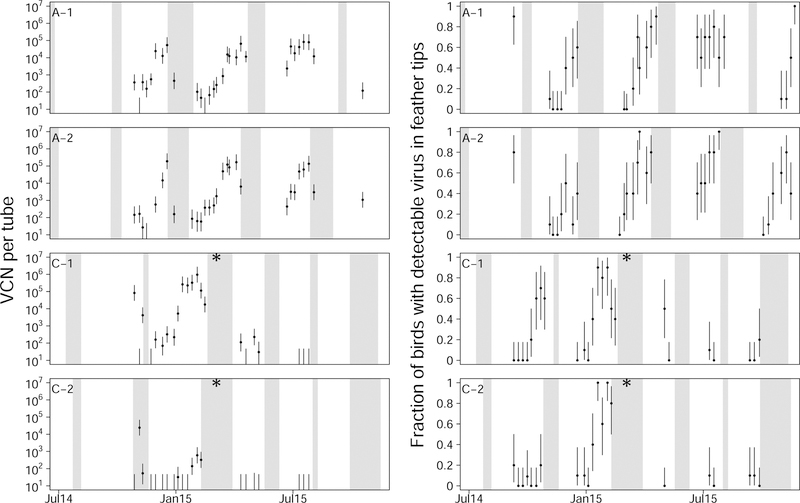
Figure 8:
Air tube data (left column) and feather tip data (right column) for two broiler farms in Pennsylvania. Symbols, colors and layout as in fig. 6. Note that the dynamics in the air tube data and feather tip data are highly similar to one another, and are highly similar to that of the corresponding houses in the cross-sectional data (fig. 6). As in fig. 6, a change in operation on farm C is denoted by an asterisk.

