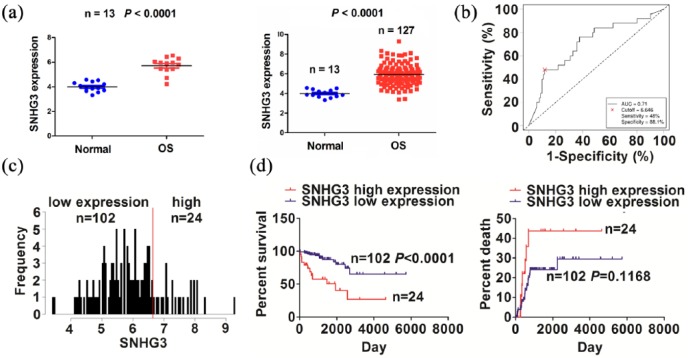
Figure 1.
The association of SNHG3 expression with the prognosis of OS patients. (a) TCGA analysis of the expression levels of SNHG3 in paired and unpaired OS tissues. (b) ROC curve analysis of the cutoff value of SNHG3 in OS patients. (c) Grouping the OS patients according to the cutoff value of SNGH3. (d) Kaplan–Meier analysis of the association of SNGH3 expression with the prognosis in OS patients.

