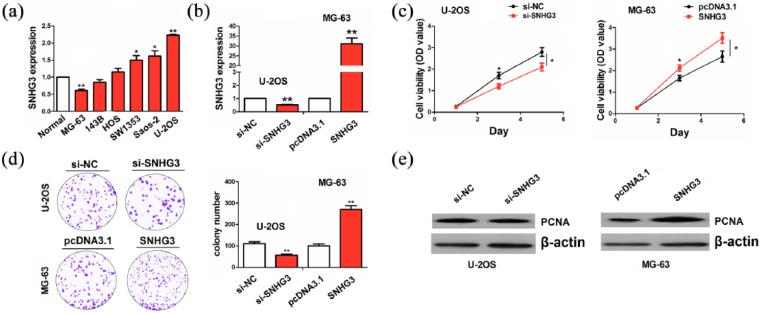
Figure 2.
SNGH3 promoted OS cell growth. (a) qRT-PCR analysis of the expression levels of SNGH3 in different OS cell lines. (b) qRT-PCR analysis of the transfection efficiency of SNGH3 or si-SNHG3 in U-2OS or MG-63 cell line. (c) MTT analysis of the effects of SNGH3 or si-SNHG3 on OS cell viability. (d) Colony formation analysis of the effects of SNGH3 or si-SNHG3 on OS cell colony number. (e) Western blot analysis of the effects of SNGH3 or si-SNHG3 on PCNA expression. Data were the means ± SEM of three experiments. *P < 0.05; **P < 0.01.

