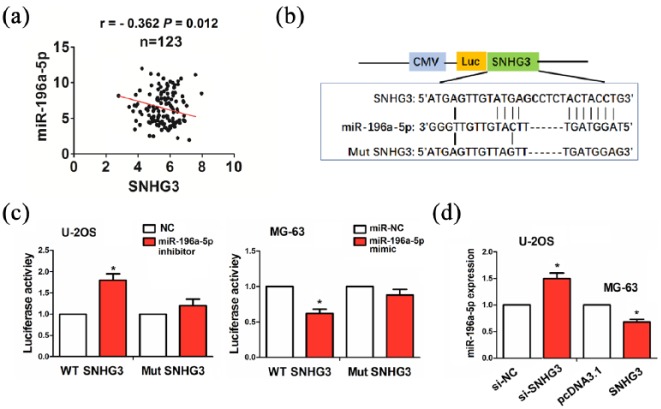
Figure 3.
SNHG3 acted as a sponge of miR-196a-5p in OS cells. (a) Pearson correlation analysis of the correlation of SNHG3 with miR-196a-5p expression in OS tissues. (b) The binding sites of miR-196a-5p with WT or Mut SNHG3. (c) The luciferase activities of WT or Mut SNHG3 after co-transfection with miR-196a-5p inhibitor or mimic and WT or Mut SNHG3 in OS cells. (d) qRT-PCR analysis of the effects of SNGH3 or si-SNHG3 on miR-196a-5p expression in OS cells. Data were the means ± SEM of three experiments. *P < 0.05.

