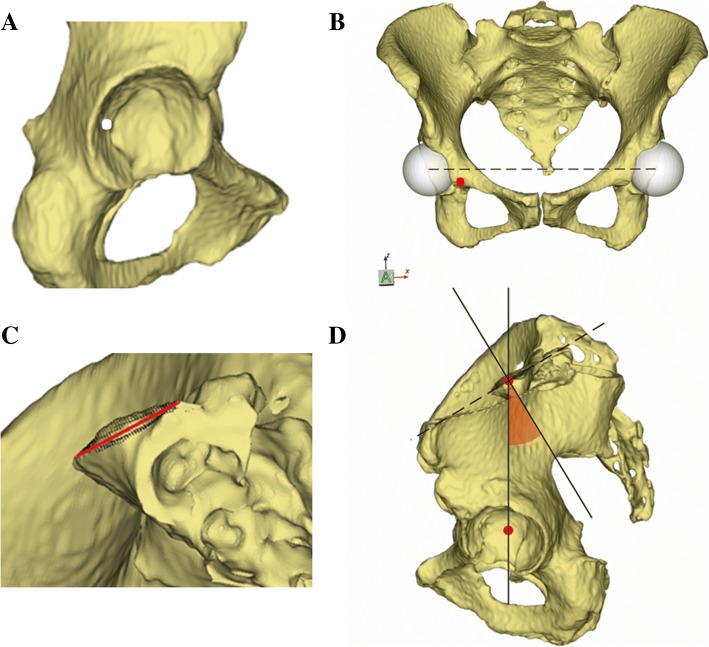
Fig. 3.
a–d The schematic shows the measurement of pelvic incidence. a one point (white) was manually located at the left acetabular fossa to initiate the analysis. b Two spheres that best fit to the acetabular fossae were generated. The center of both spheres and hip axis were calculated by the software. c Surface points (black) were located on the sacral endplate, and a sagittal line segment that best fits to the sacral endplate was extracted from the surface points. d The midpoint of the sacral endplate was automatically determined by the software and pelvic incidence was calculated as the angle between the line perpendicular to the midpoint of the sacral endplate and the line connecting the midpoint with the hip axis

