Fig. 2.
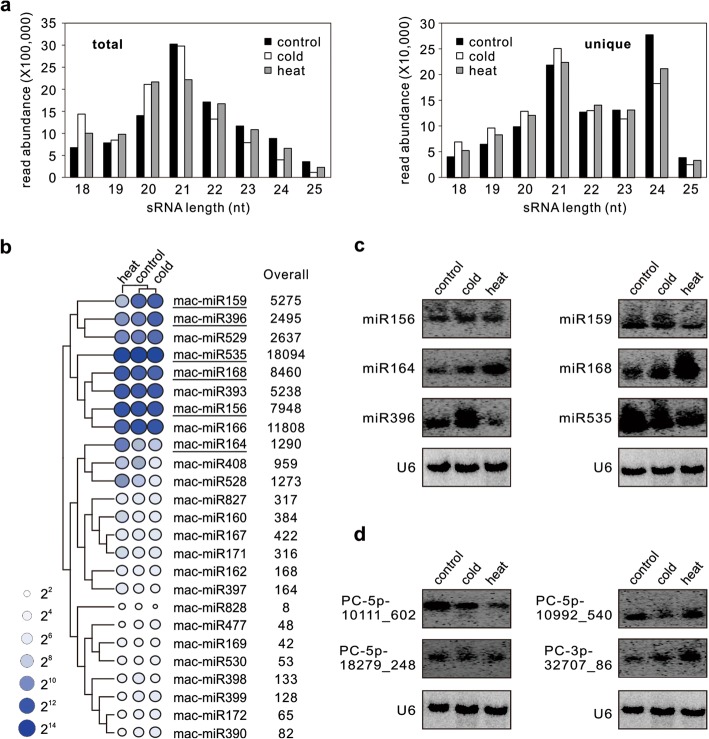
sRNA and miRNA expression profiling in banana. a Length distribution of total (left panel) and unique (right panel) sRNA sequences in banana stored at control temperature and subjected to cold and heat treatments. b Heat map and overall read abundance of the known miRNAs in the control, cold- and heat-stressed samples. Read abundance was normalized and expressed as reads per million (RPM) of genome-matched reads in each sample, as denoted by color and illustrated at the top-leaf corner of the panel. Known miRNAs selected for validation were underlined. c, d RNA gel blot analysis of selected known (c) and banana-specific (d) miRNAs in different samples. Total RNA was isolated from control, cold-stressed and heat-stressed banana peel and probed with end labeled antisense oligonucleotides. U6 served as a loading control. Blotting results from probing and reprobing the same filter were grouped together

