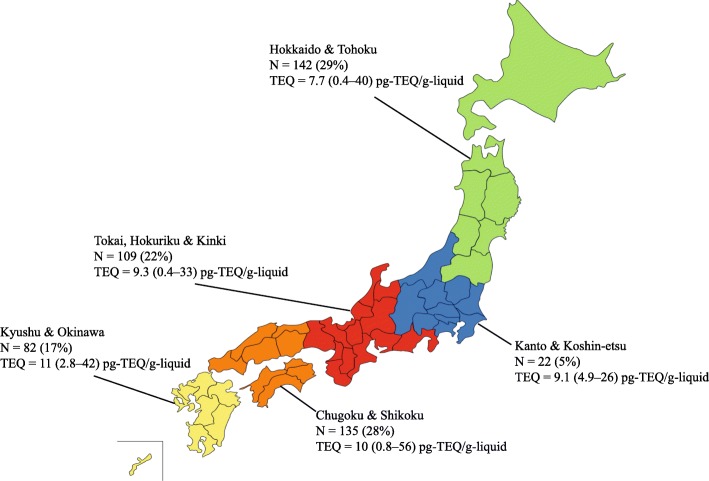
Fig. 1.
Map of Japan showing the origins of the 490 participants [N (%)] and their median blood dioxin total TEQ (range) in pg TEQ/g lipid. The geographic patterns of total TEQ presented in each region do not refer to region-level blood dioxin estimates. Instead, this geographic distribution represents the participants involved in this study. Definition of abbreviations: TEQ, toxic equivalent

