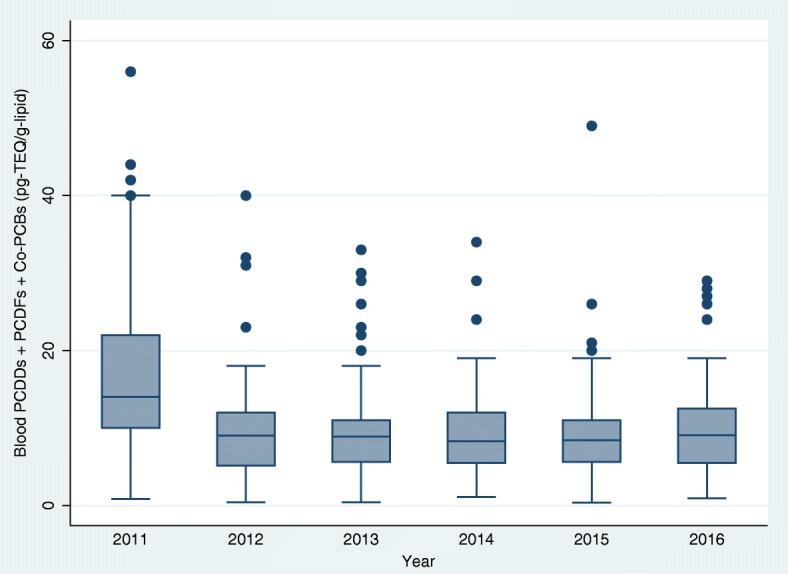
Fig. 2.

(Showing whiskers). Box plot (median, interquartile range and range) of total TEQ in the blood (in pg TEQ/g lipid) by survey year of the ‘survey on the exposure to dioxins and other chemical compounds in humans,’ 2011 to 2016. The median (range) of total TEQ by survey year was 14.0 (0.8–56.0), 9.0 (0.4–40.0), 8.9 (0.4–33.0), 8.3 (1.1–34.0), 8.4 (0.3–49.0) and 9.0 (0.9–29) in 2011, 2012, 2013, 2014, 2015 and 2016, respectively. The Kruskal-Wallis test (p < 0.001) was used to compare the differences in total TEQ in blood across the survey years. Definition of abbreviations: PCDDs, polychlorinated dibenzo-dioxins; PCDFs, polychlorinated dibenzofurans; Co-PCBs, coplanar polychlorinated biphenyls; TEQ, toxic equivalent
