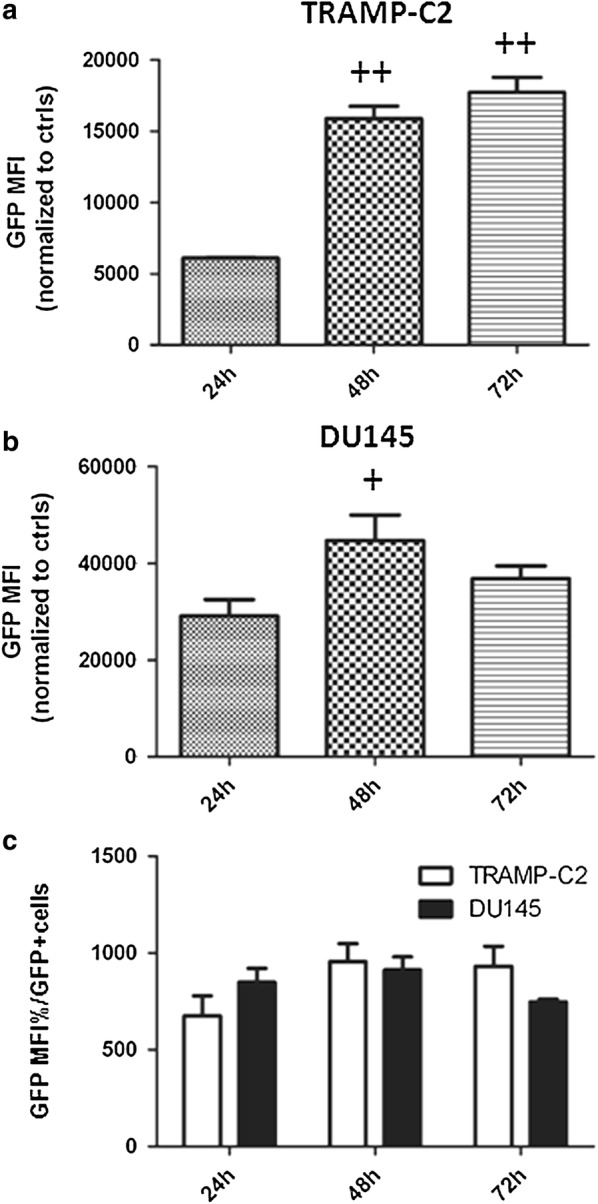
Fig. 3.

GFP protein expression in TRAMP-C2 and DU145. a TRAMP-C2 and b DU145 cells were transduced with 10 MOI of hAd-GFP and the median fluoresce intensity of GFP transgene (GFP MFI) was analyzed by flow cytometry at 24, 48 and 72 h post transduction. c GFP MFI was corrected by the percentage of GFP positive (GFP+) cells to compare GFP expression in equal number of transduced cells. Data are representative of three biological repeats analyzed by (a, b) one way ANOVA, Tukey’s post-test +p<0.05, ++p < 0.01; c two ways ANOVA, Bonferroni’s post-test, *p < 0.05, **p < 0.01
